Census 2010
Custom Data for Montgomery County, Maryland and its Communities
Planners and demographers at the Planning Department's Research and Special Projects Division (RSP) have analyzed Census 2010 data at several levels of geography within Montgomery County.
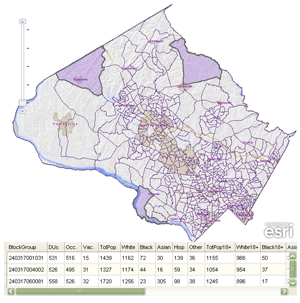
- Try our interactive demographic map tool to view Census 2010 data for custom, user-defined areas.
- Read highlights of our analysis of the latest available Census 2010 data.
- Get more of our Census 2010 data products, including maps, publications and downloadable data tables.
Census releases
The U.S. Census Bureau released its first rounds of population and household data from the 2010 decennial census in early 2011. As the Bureau releases data throughout 2011 and 2012, planners will provide more detailed demographic and housing data for Montgomery County, neighboring jurisdictions and areas within the County. Jump to current data tables.
- Detailed Population and Housing Profiles (August 2011)
Detailed Montgomery County data from the Summary File 1 release includes cross-tabulation of age, sex, detailed race and Hispanic or Latino origin, families, relationships, households, tenure, and mortgage status. Most of the data is available from the Census Bureau for small areas such as tracts and blocks. - Demographic Profile (May 2011)
This summary data file contains information on topics such as sex, age, race, Hispanic or Latino origin, household relationship, household type, group quarters population, housing occupancy, and housing tenure. - Redistricting Data (April 2011)
This data set, 2010 Census Redistricting Data (P.L.94-171), provides the basic population counts that are needed to redraw state and local legislative districts. - View schedule of upcoming 2010 Census data releases.
Census 2010 highlights
- Montgomery County's population reached 971,777 in 2010, an increase of nearly 100,000 people (11.3 percent) from 2000:
- Montgomery County is now the 42nd most populous county in the nation, up from 49th place in 2000. It remains the second largest jurisdiction in the Washington, D.C. metro area, next to Fairfax County, Virginia, with 1,081,726 residents.
- The top three population centers in Montgomery County are Bethesda (90,499), Germantown (86,395) and Silver Spring (71,452). Gaithersburg, Rockville, Wheaton and Aspen Hill each have populations of 50,000 or higher.
- Germantown had the largest population increase (19,955), followed by Rockville with 13,810 additional persons. Clarksburg, which had very few residents in 2000, grew at the fastest pace (480 percent); Aspen Hill was a distant second, increasing by 57 percent.
- Consistent with national and regional population trends, Montgomery County's population grew more diverse over the past decade:
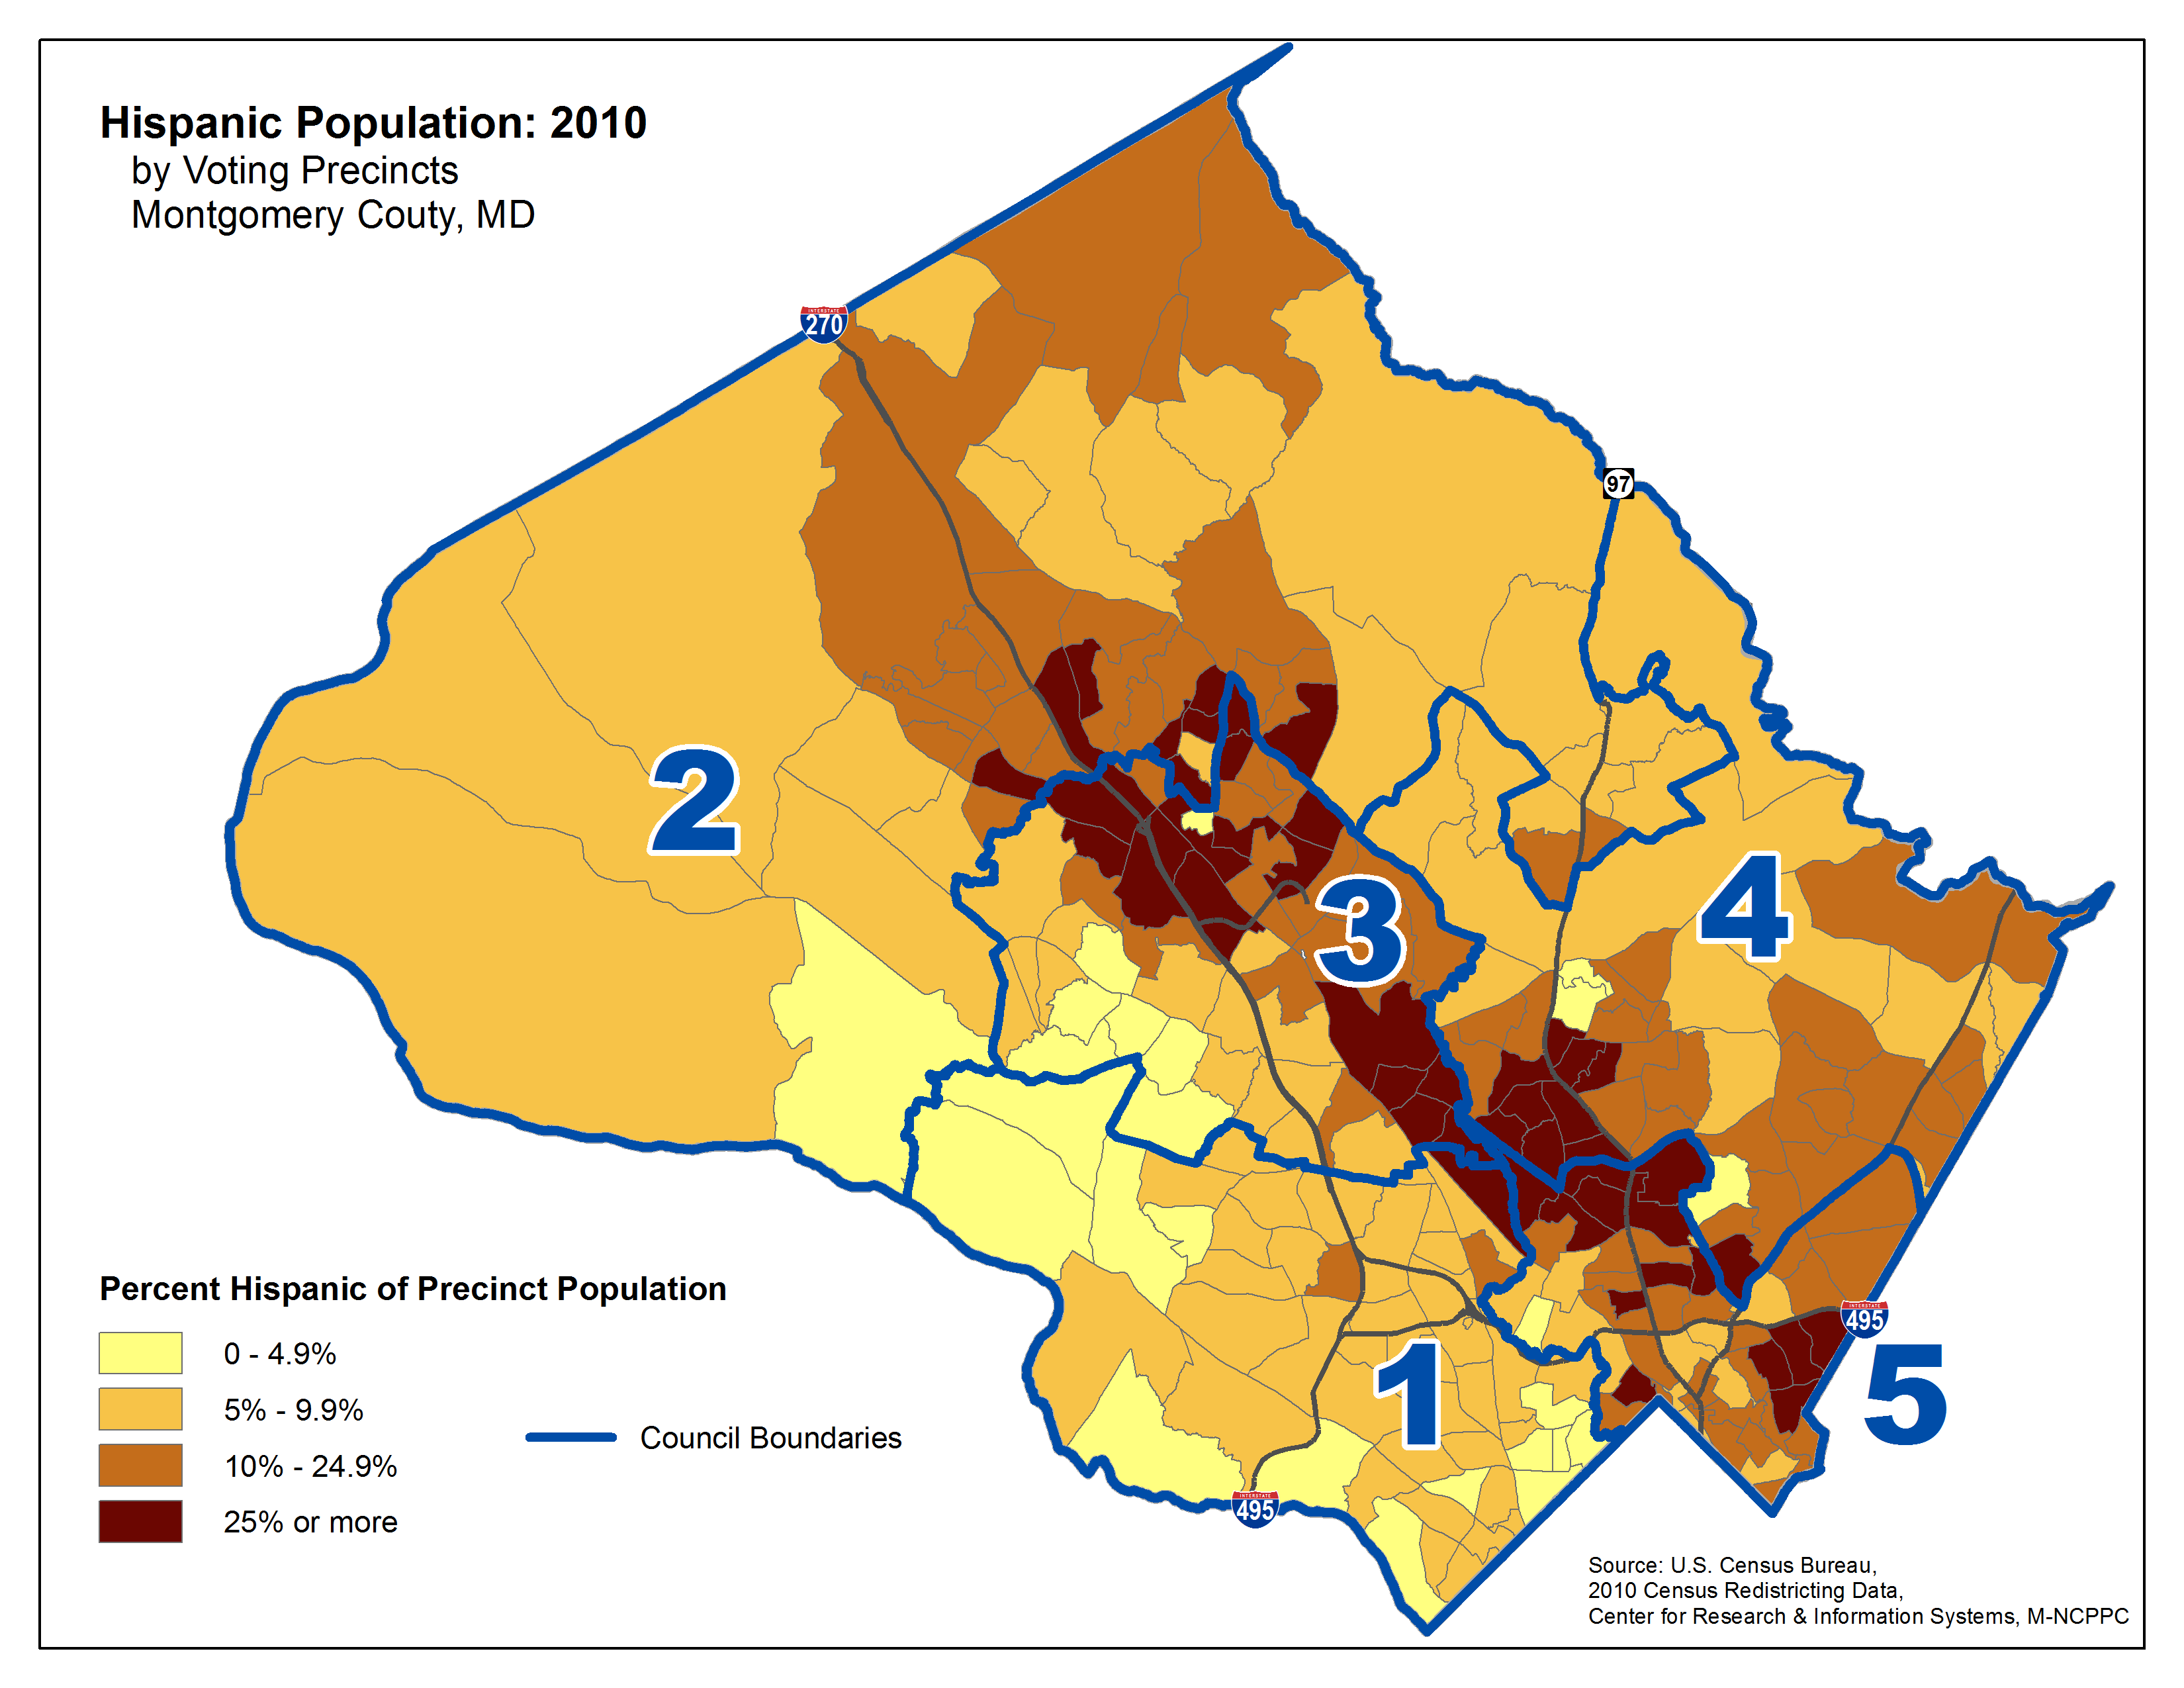
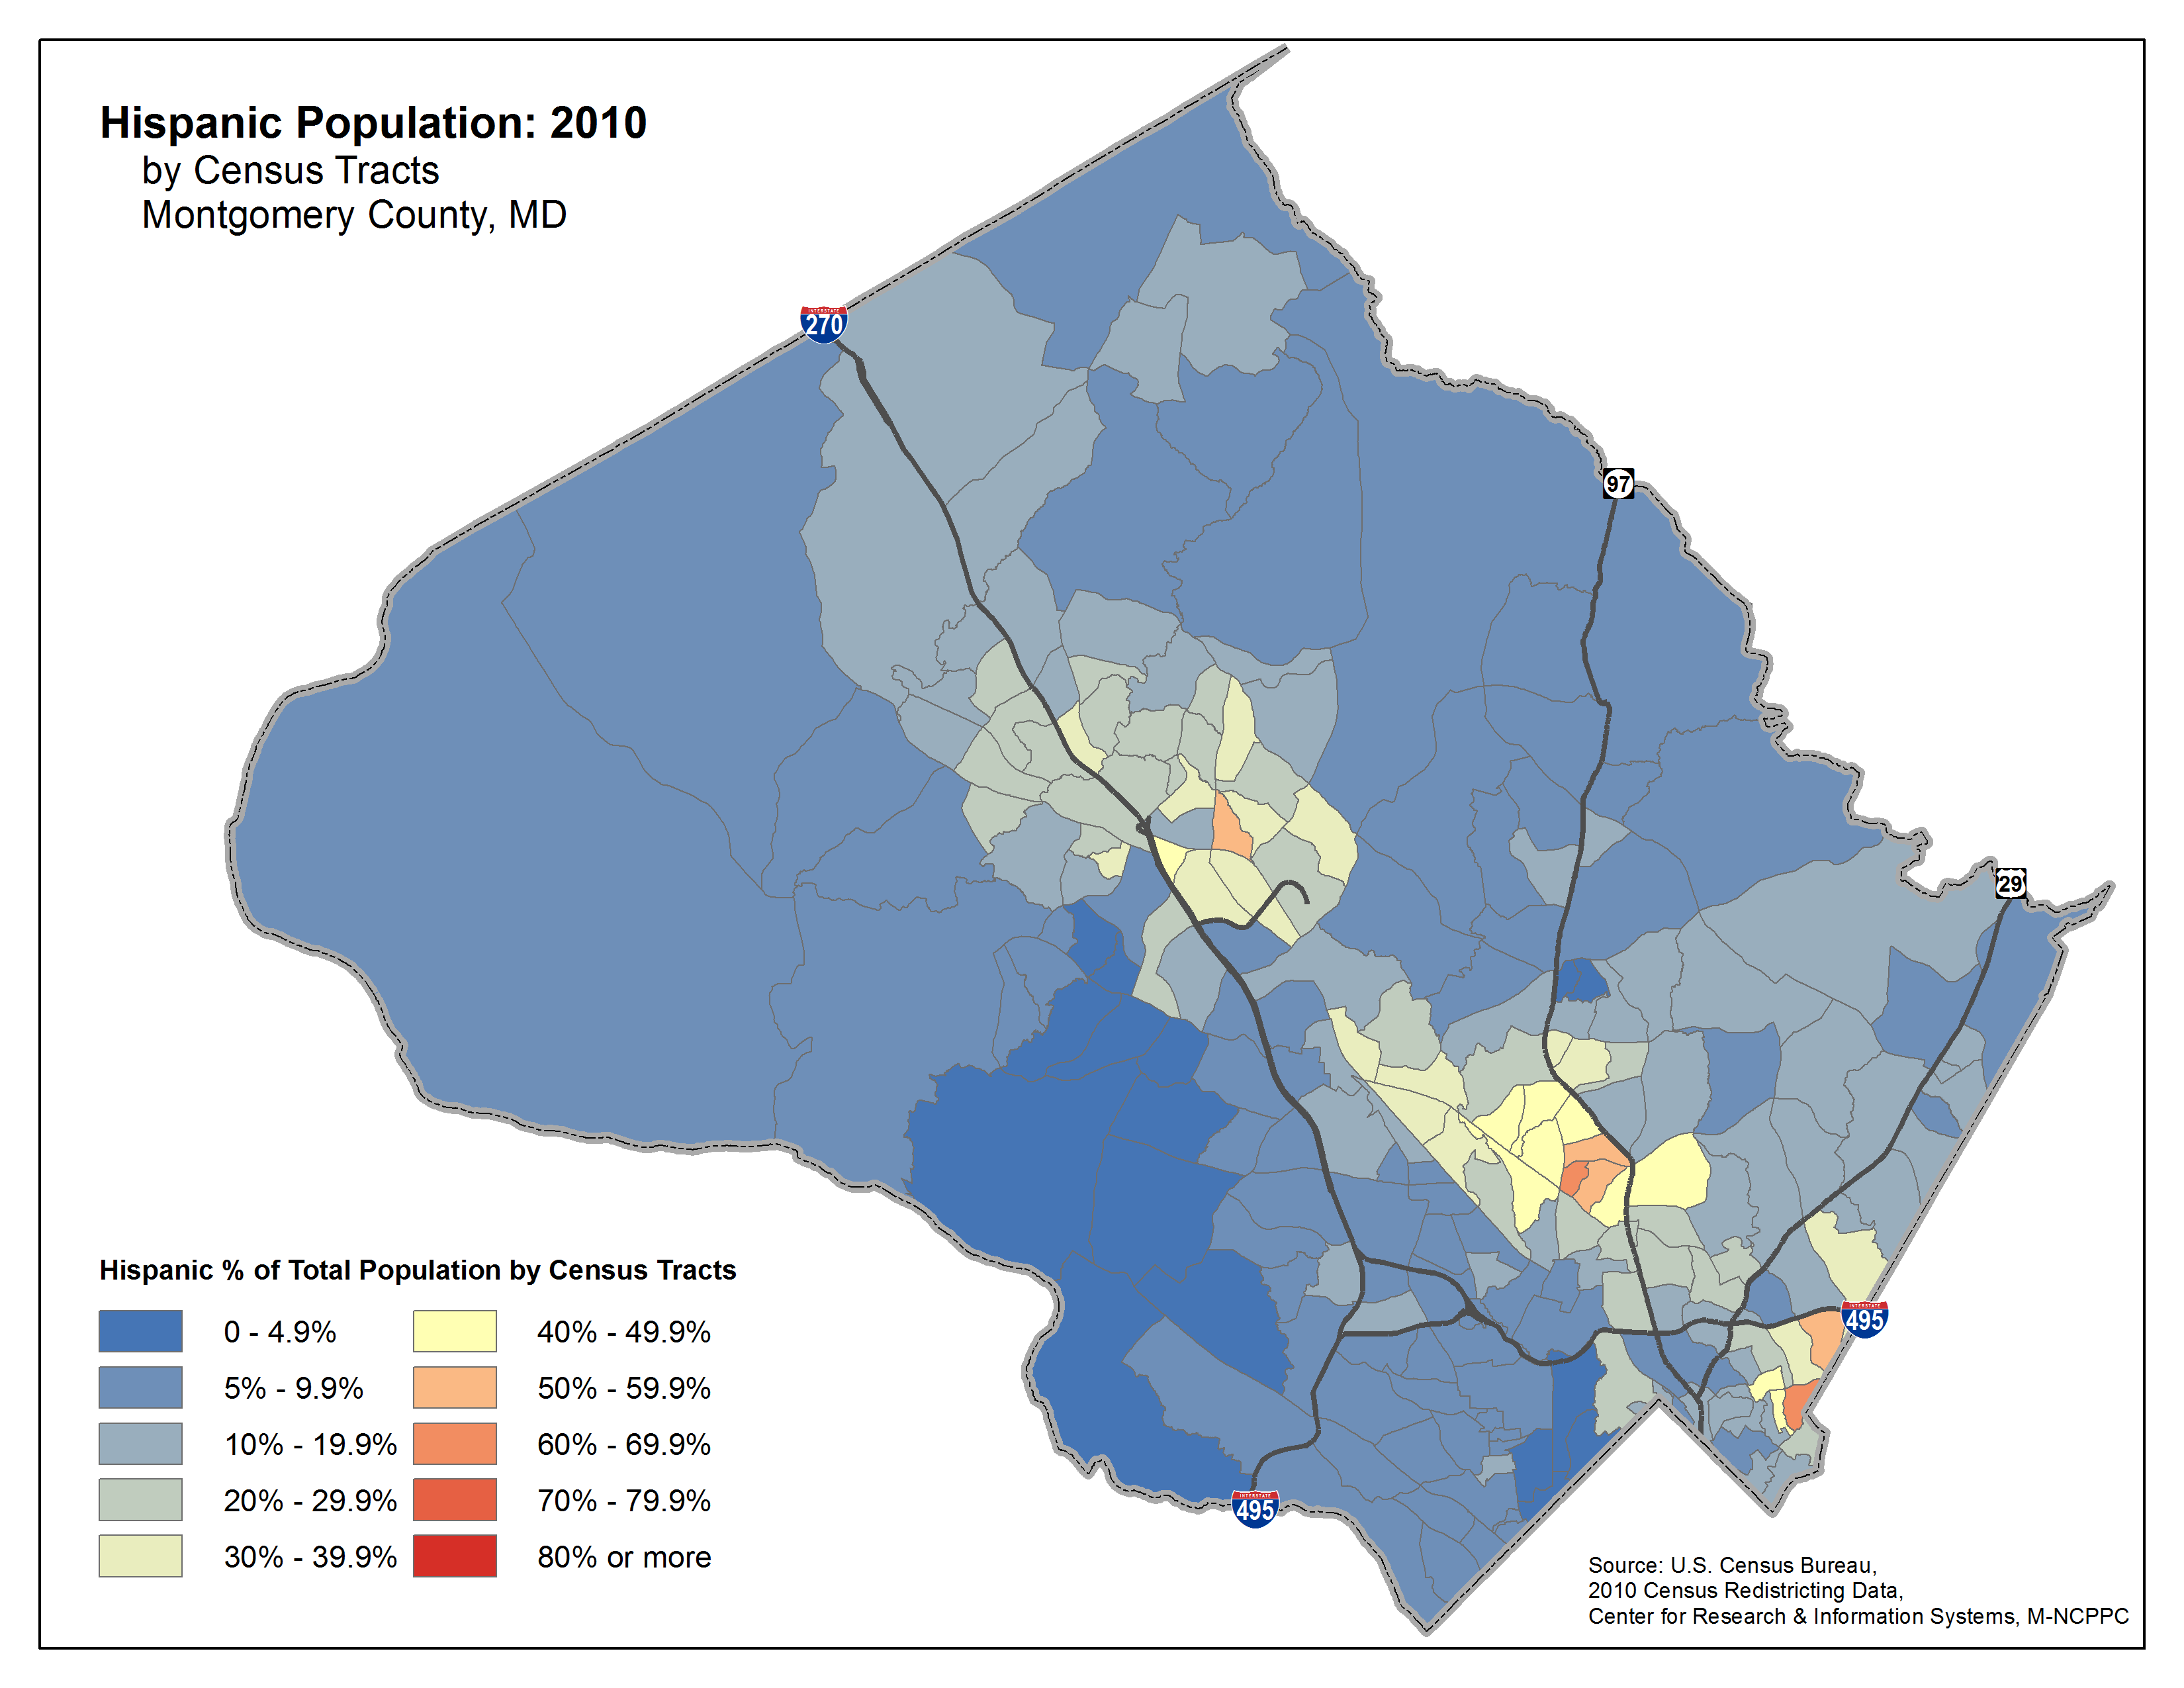
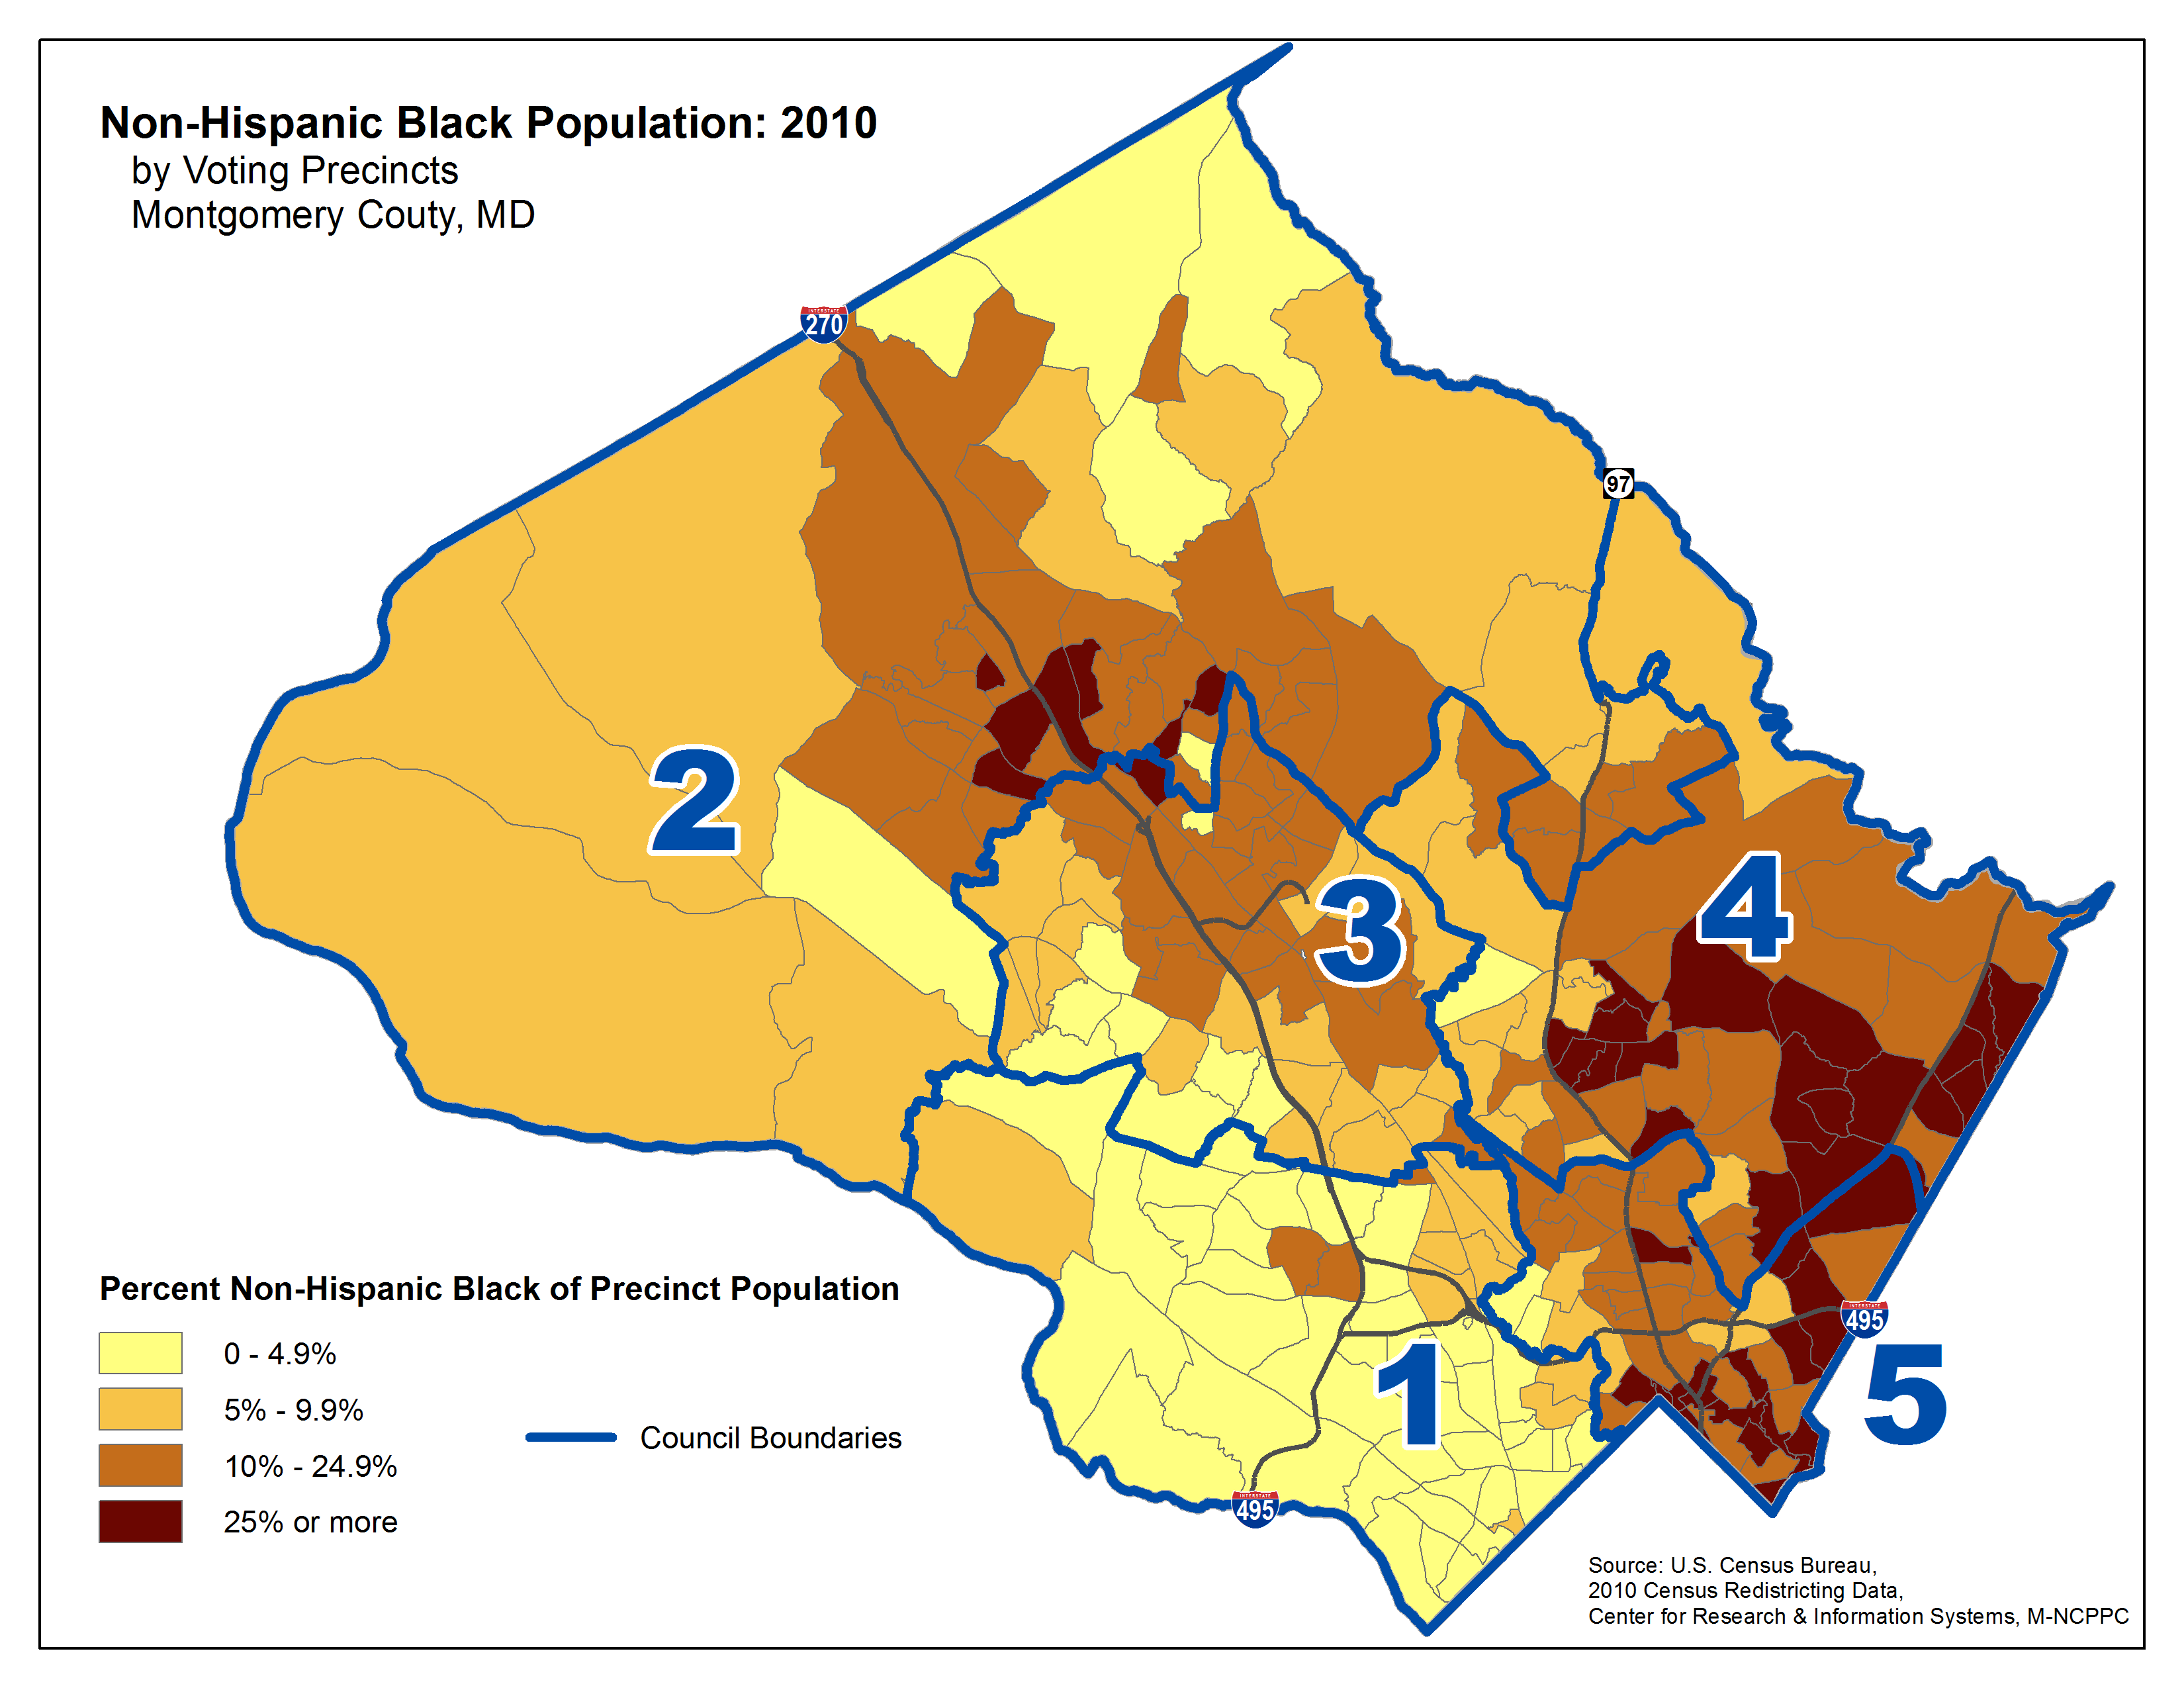
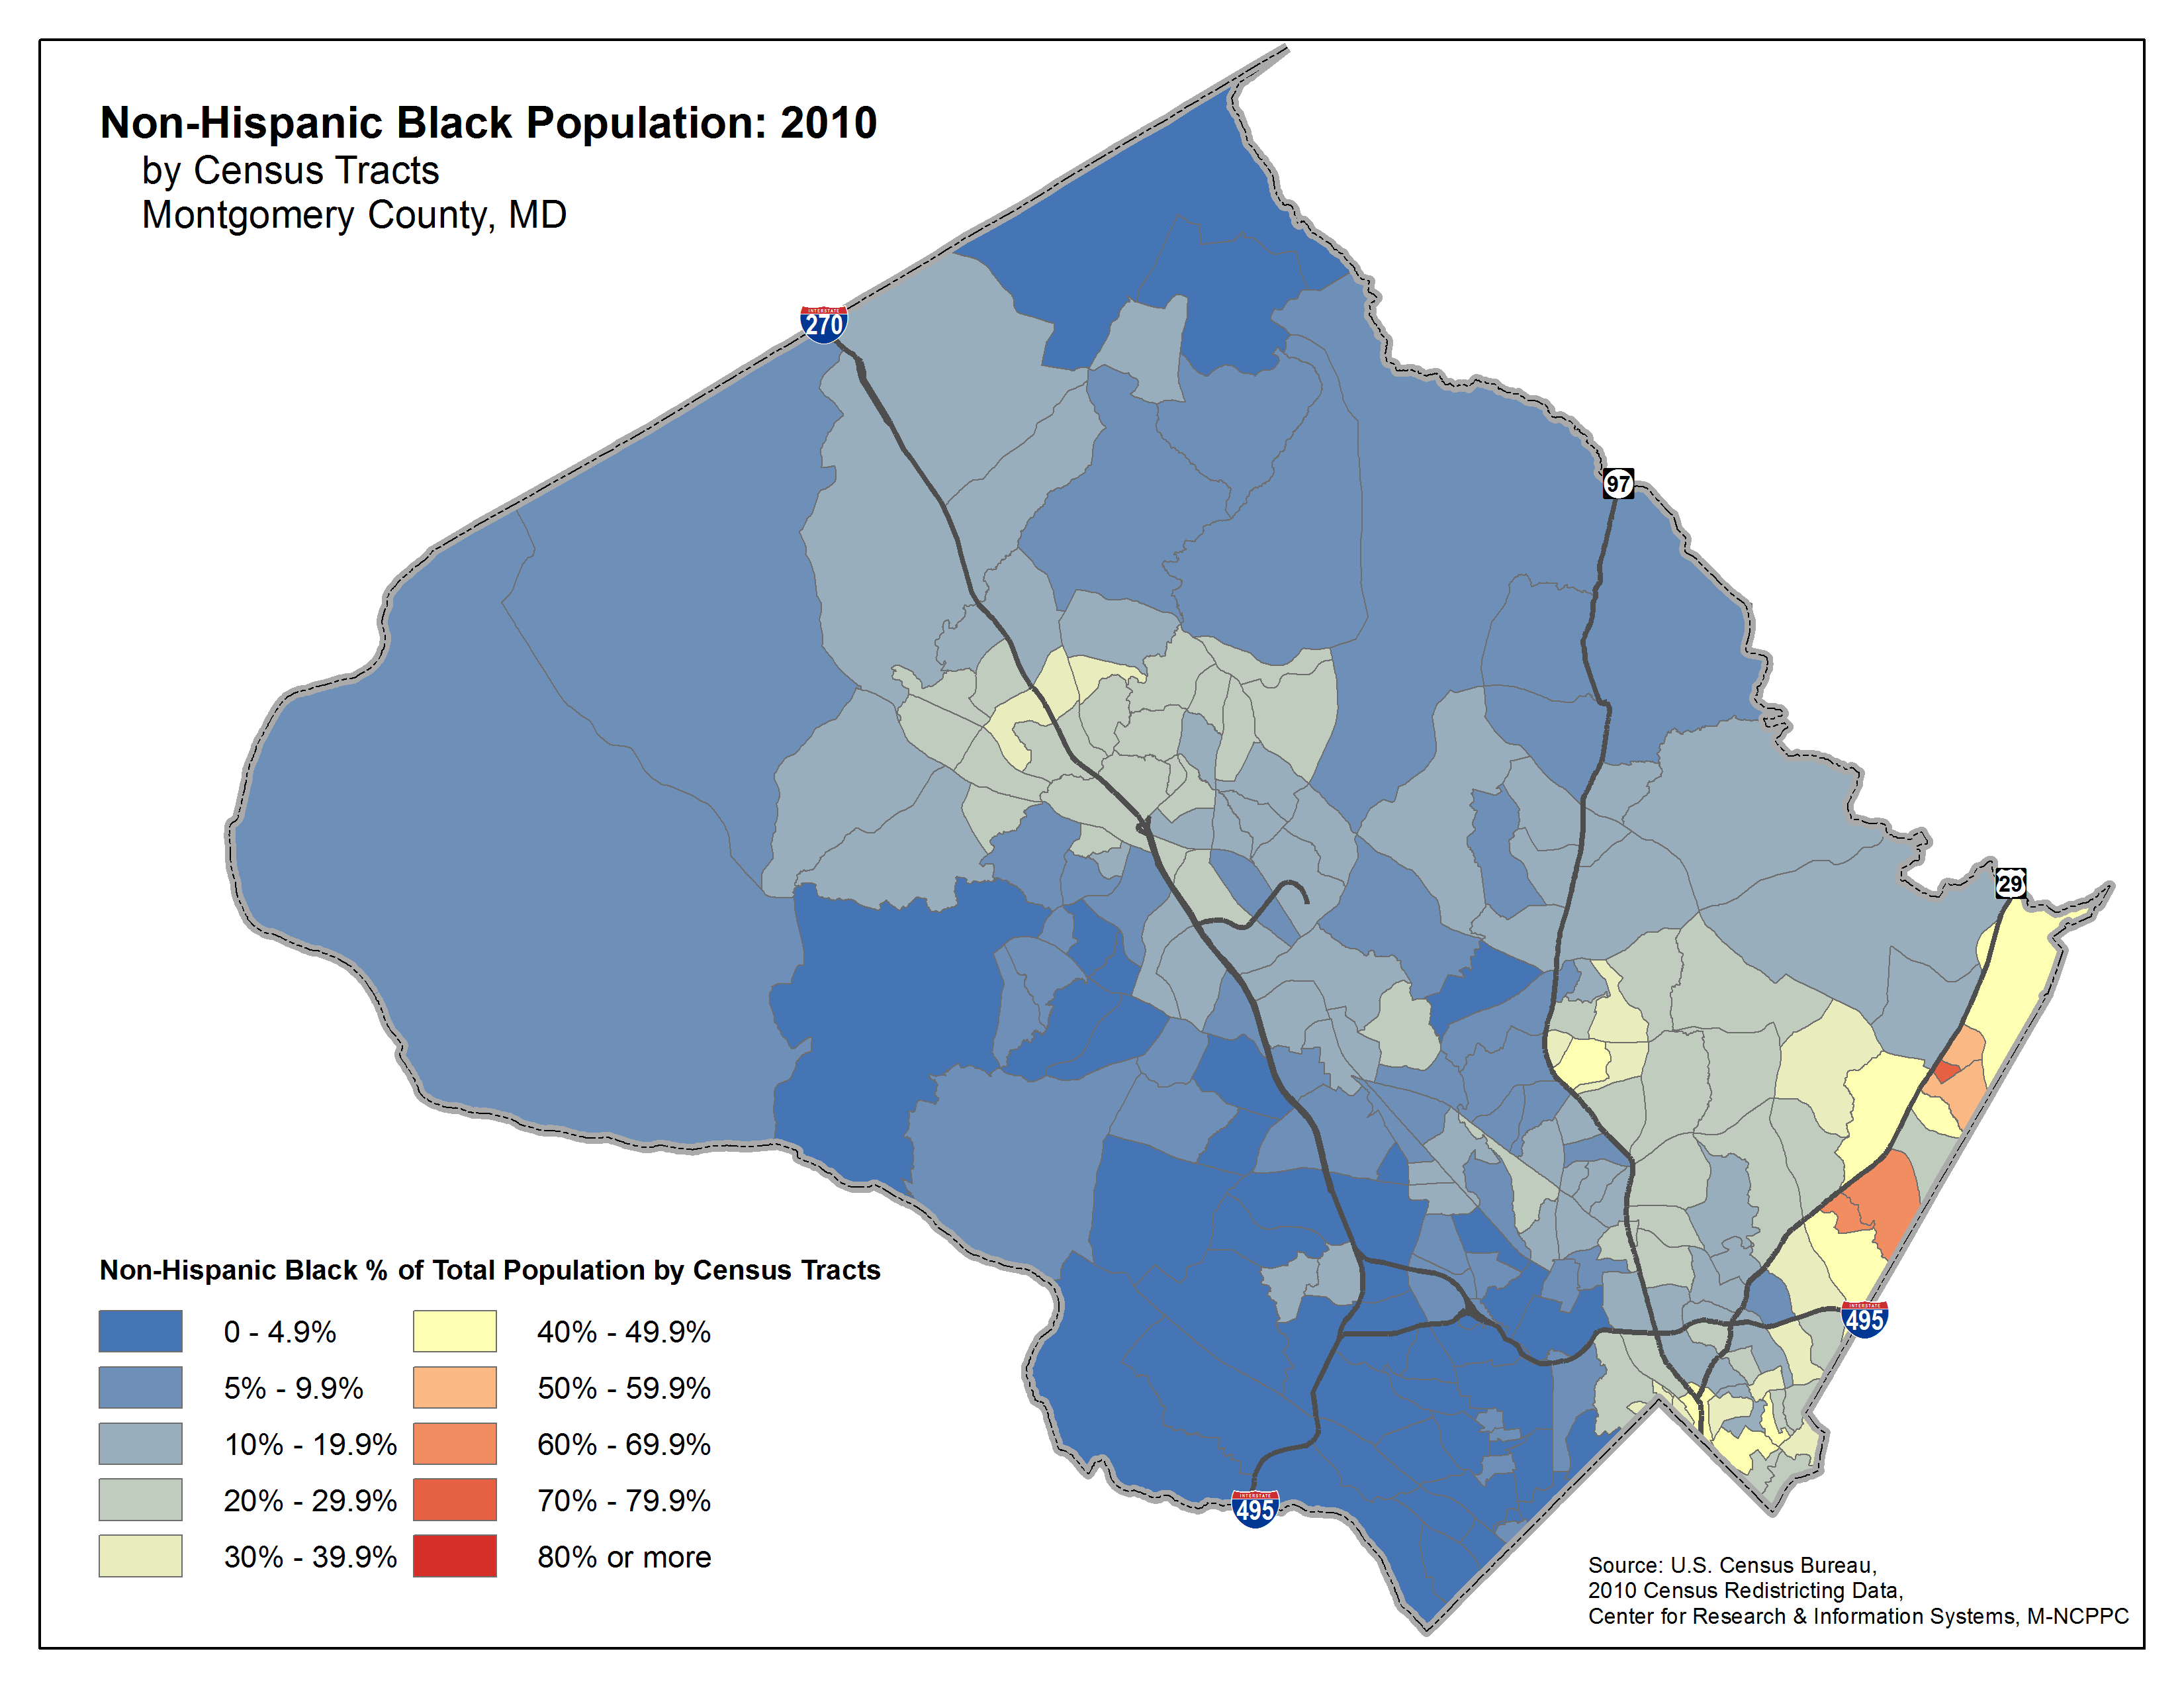
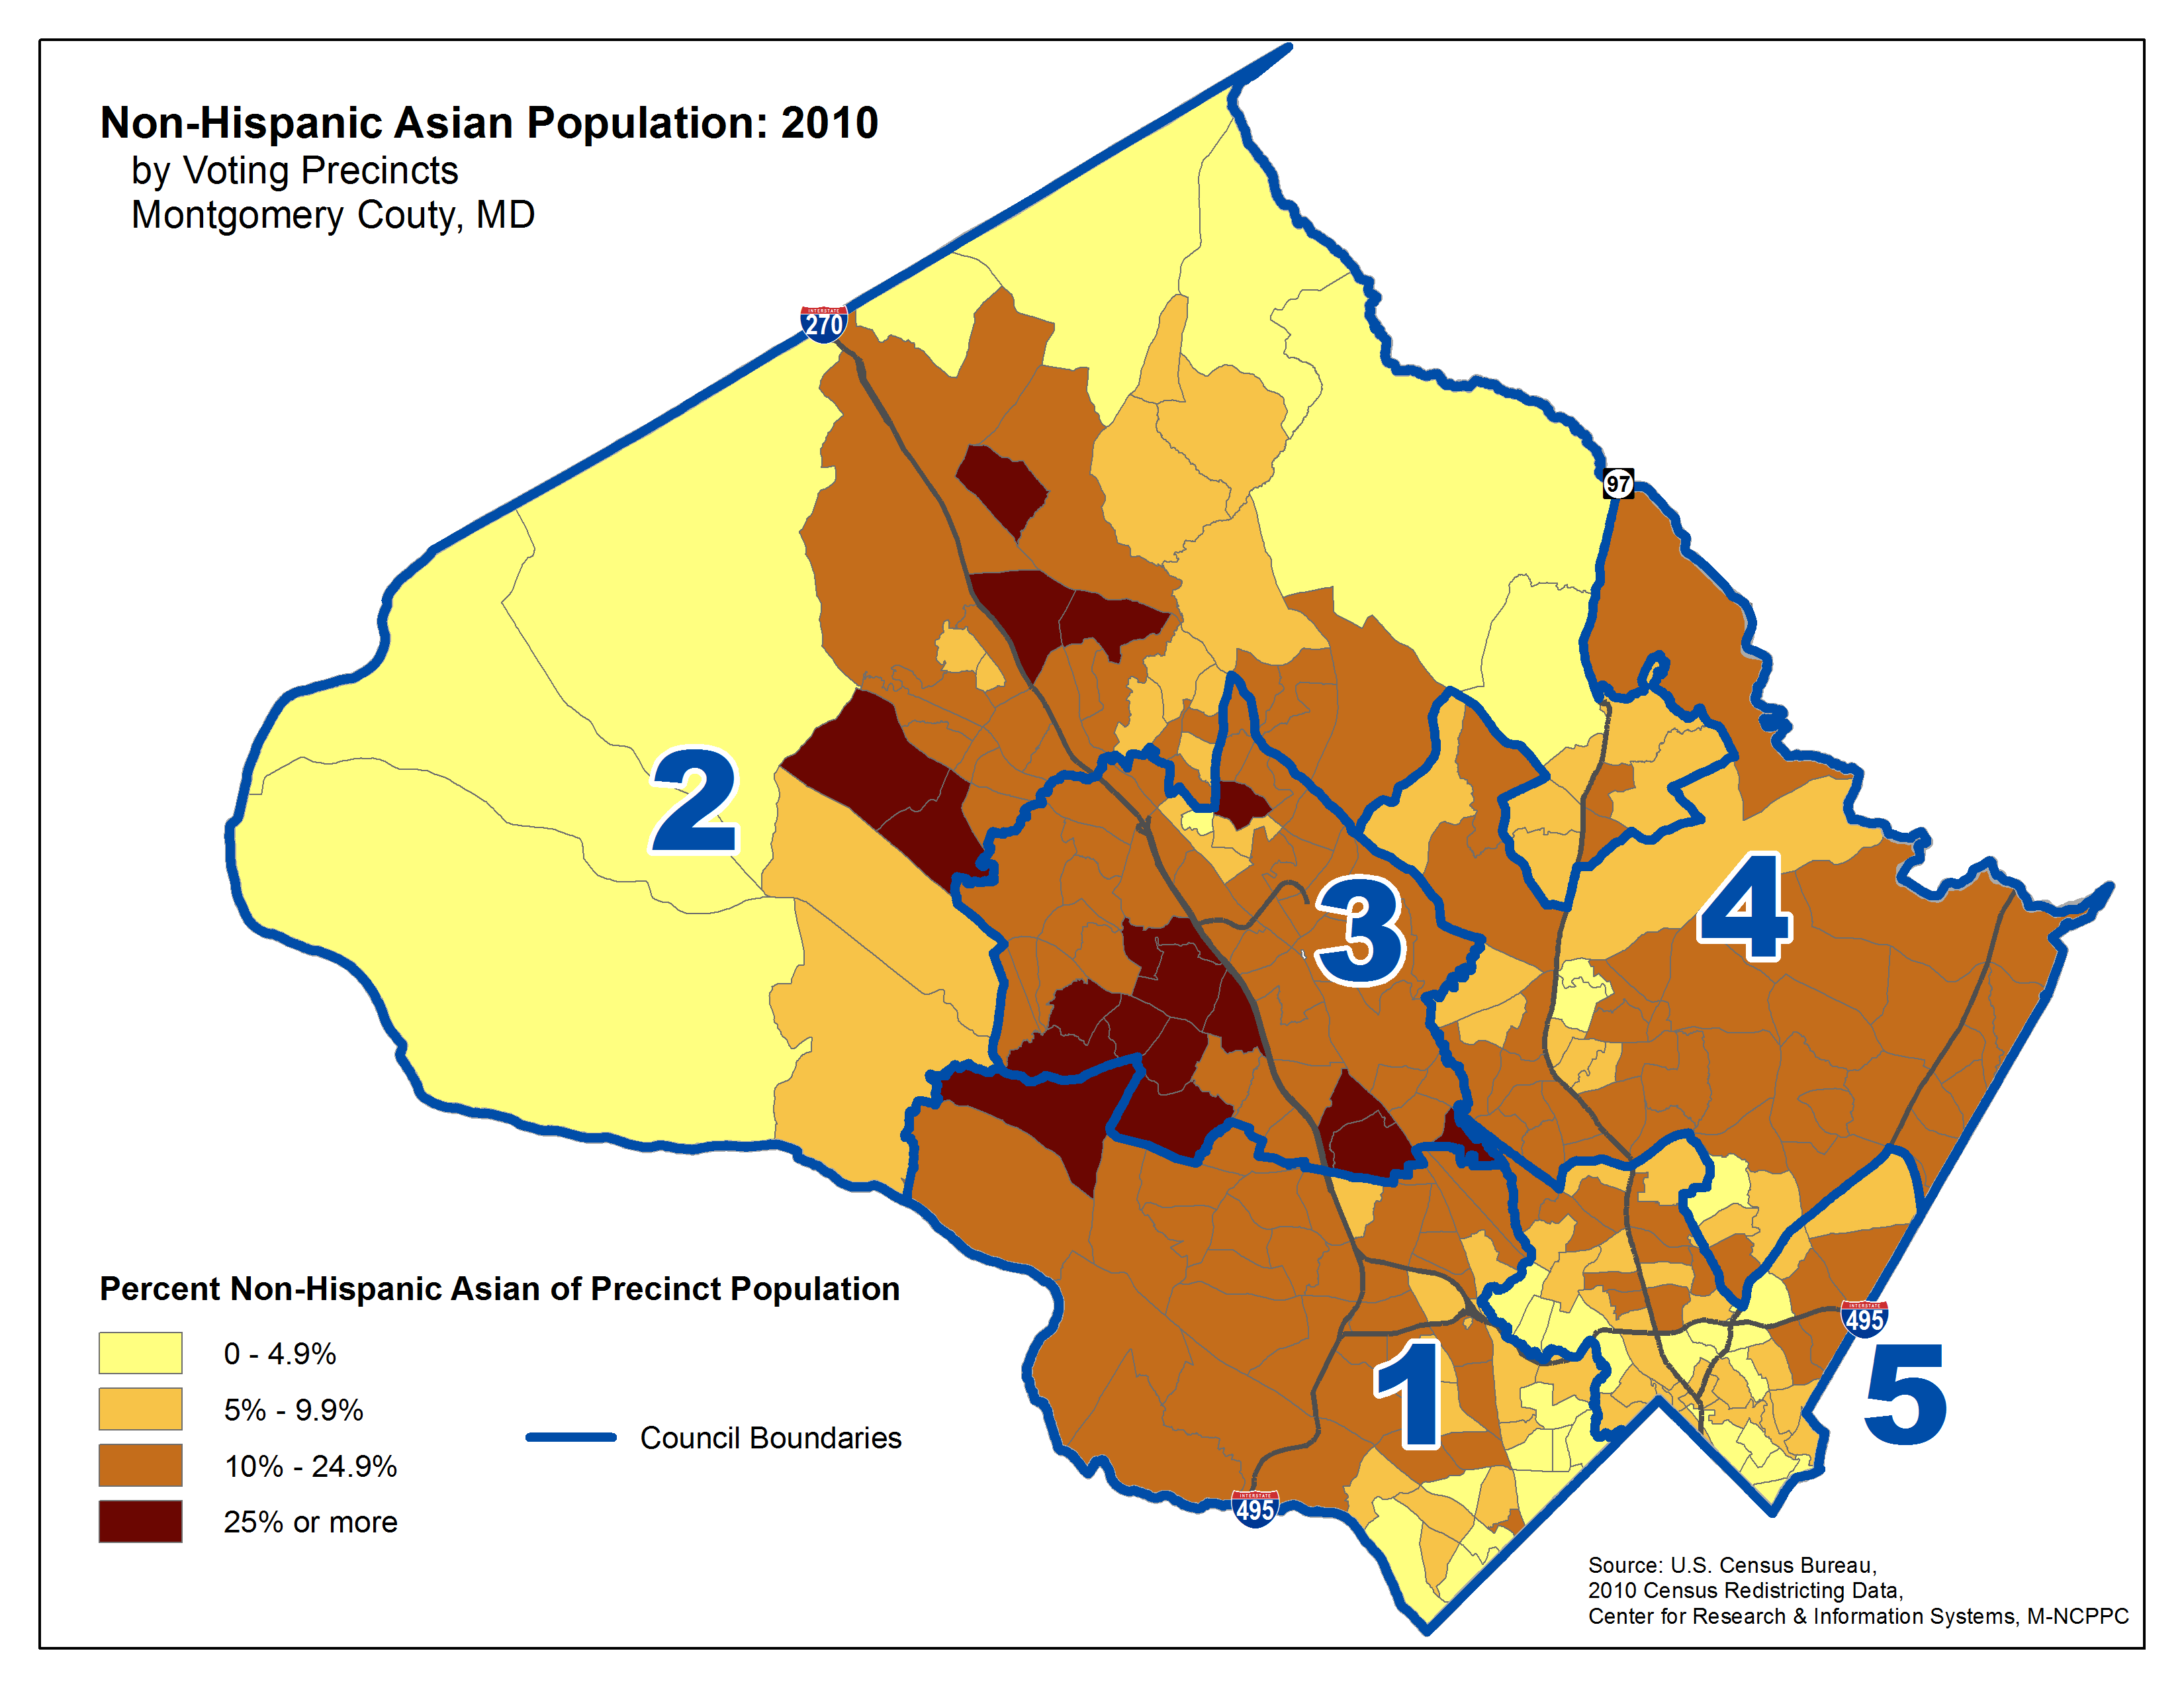
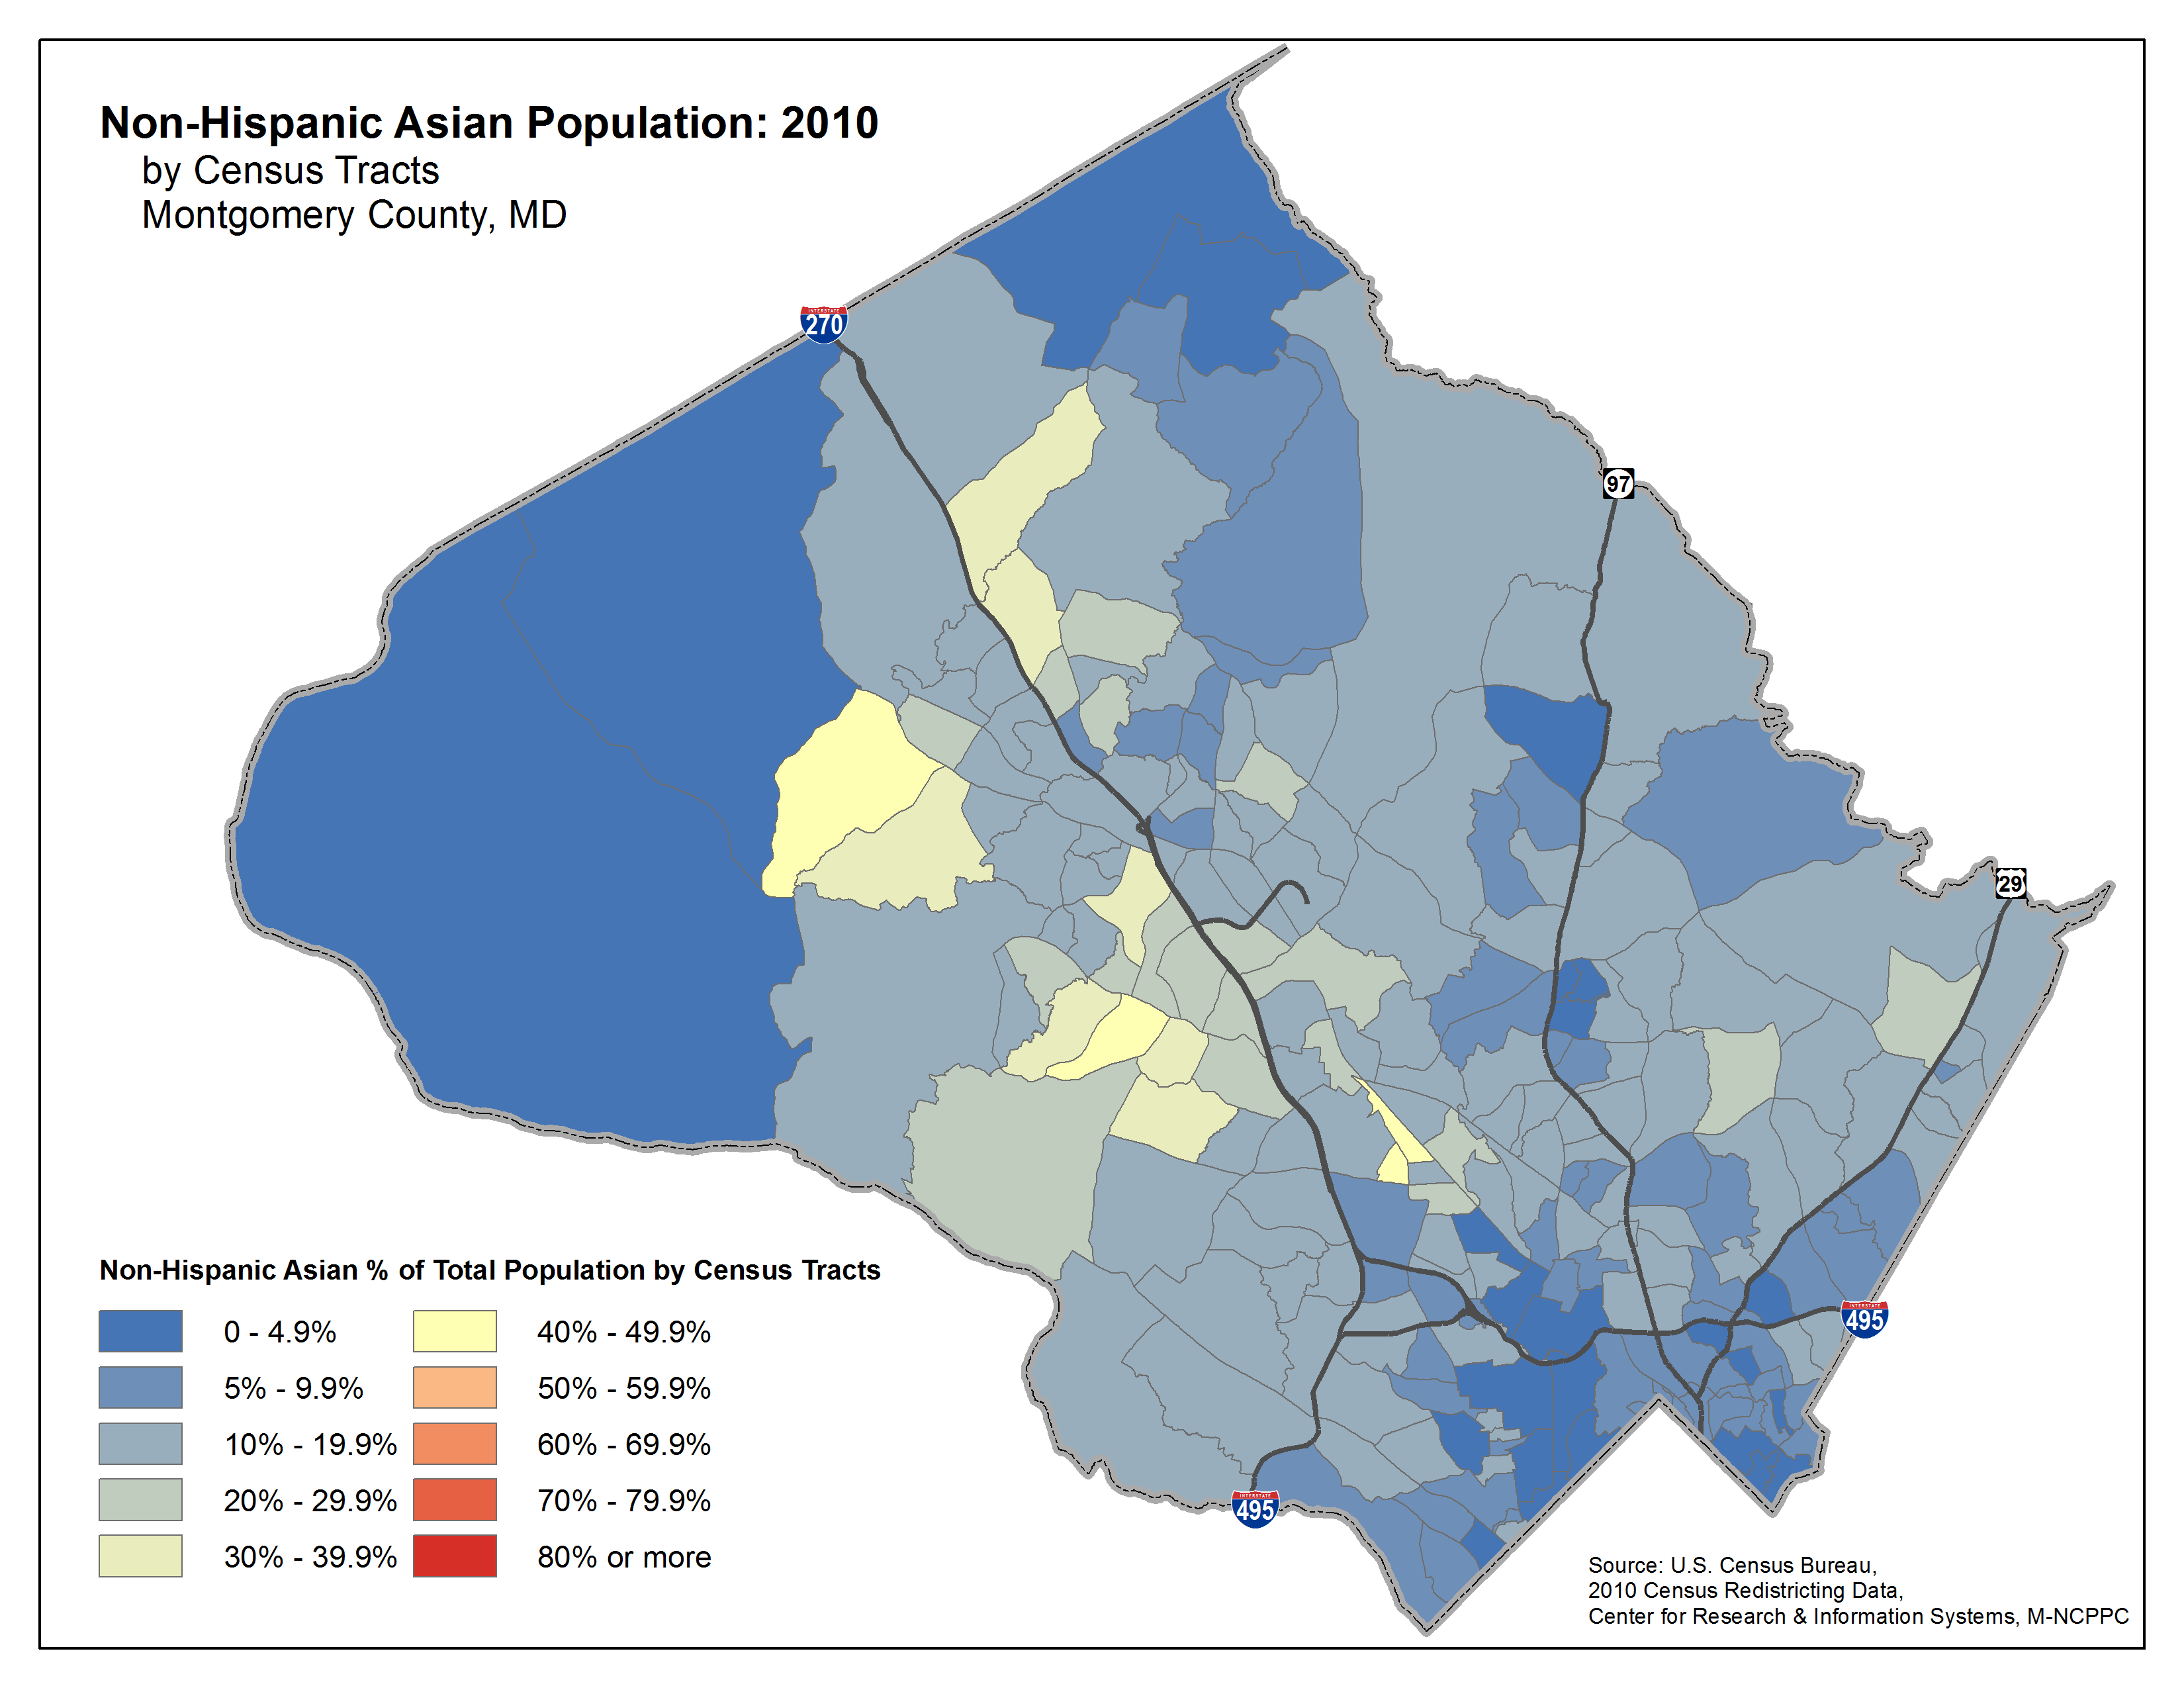
- Montgomery County's Hispanic population grew at the fastest pace (64.4 percent), followed by Asian and Pacific Islanders (37.0 percent), Blacks (25 percent) and other minority groups (21.3 percent).
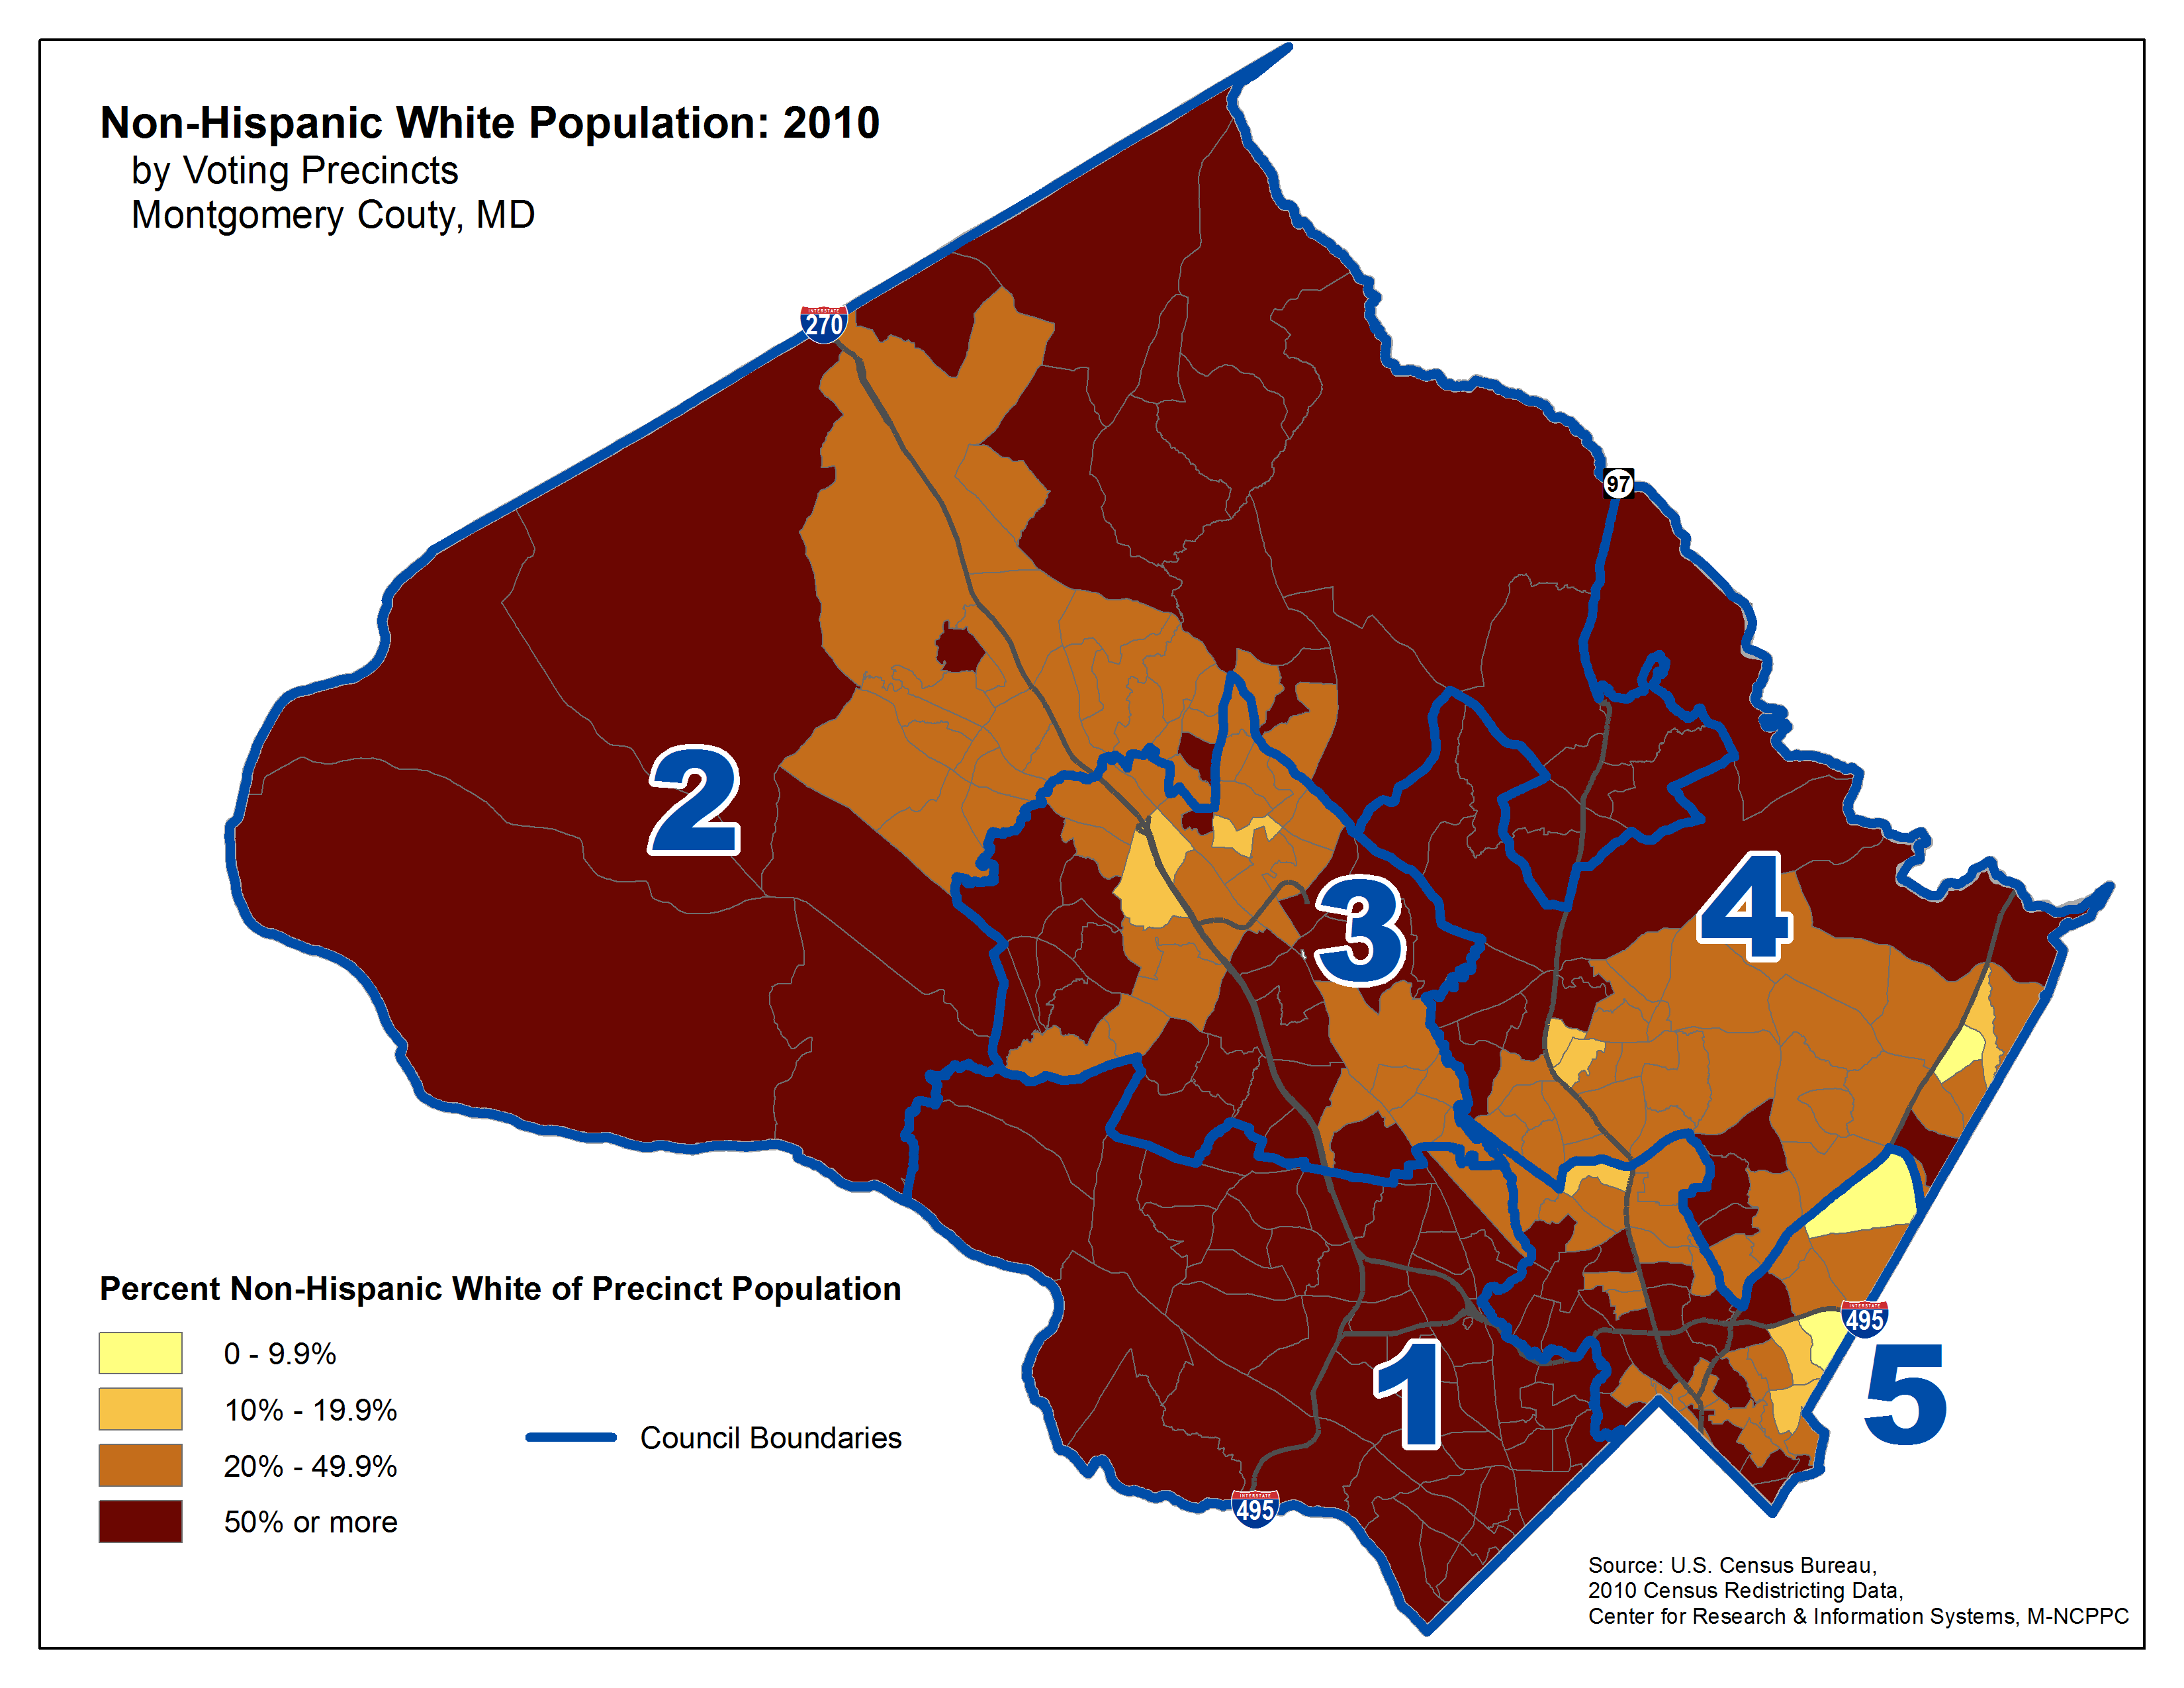
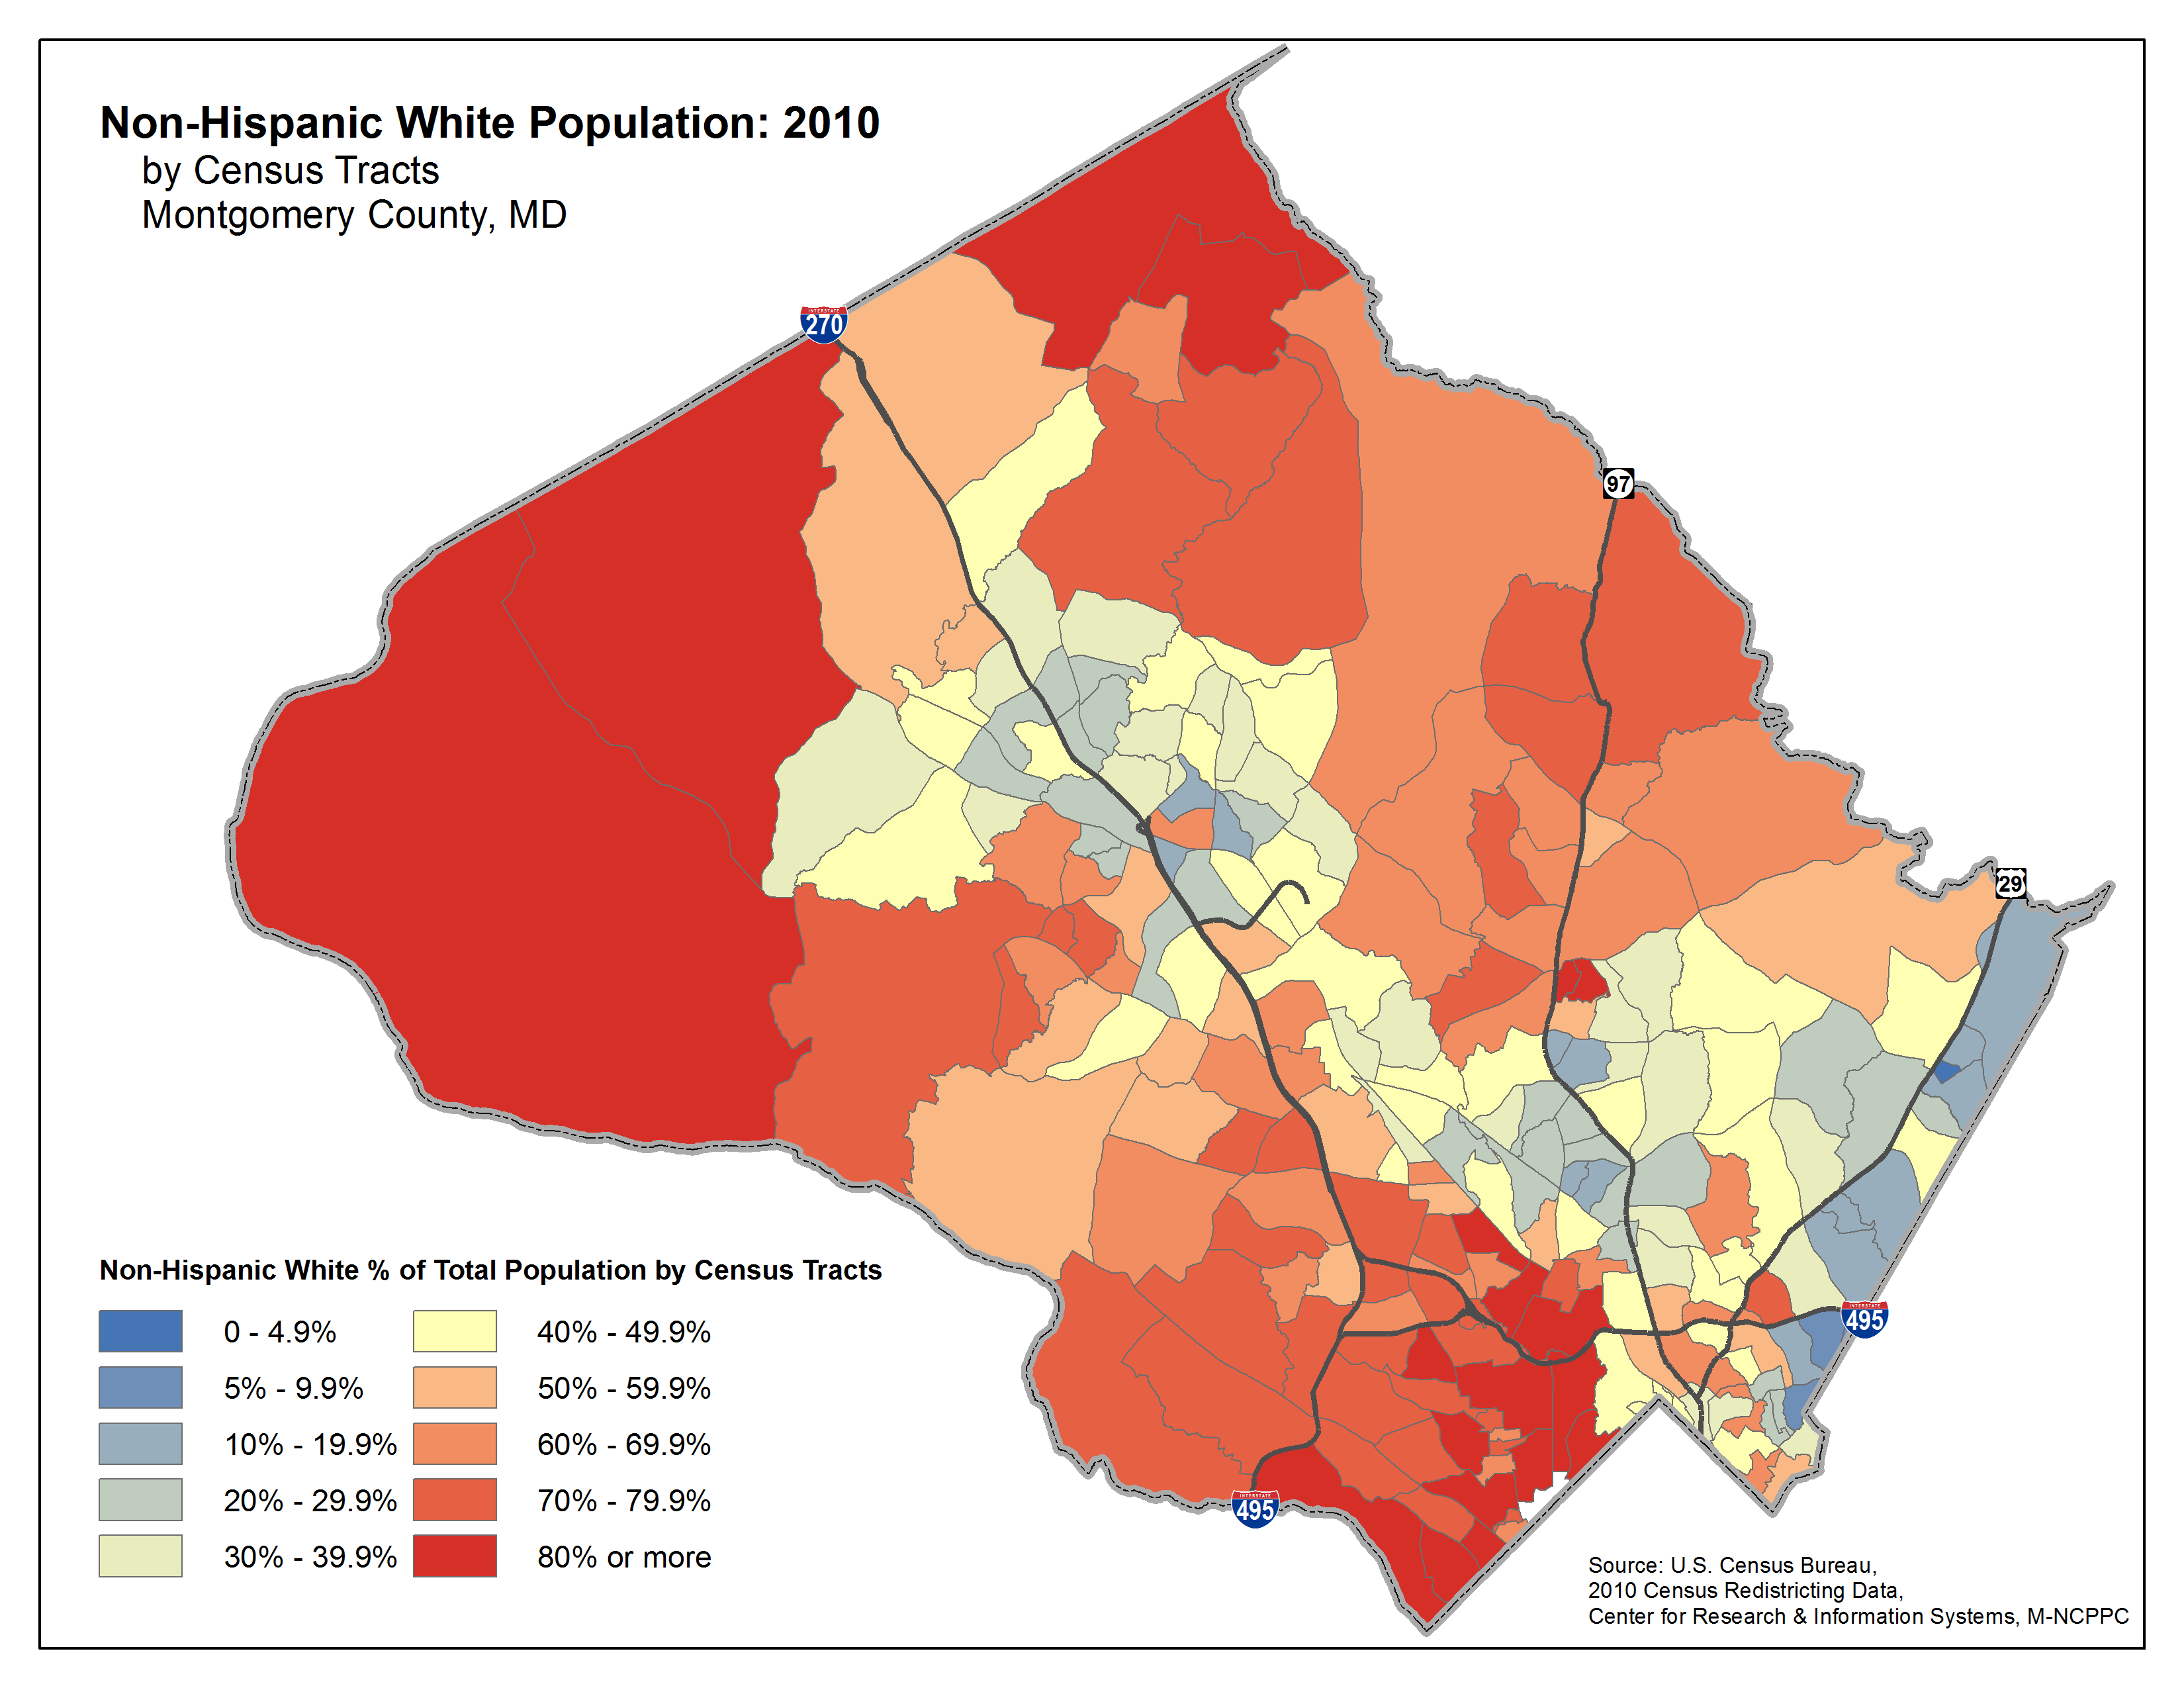
- The 39.3 percent increase in all minority groups combined offset a 7.8 percent decline in the number of non-Hispanic Whites living in Montgomery County.
- Most neighboring counties also had a decrease in non-Hispanic White population, including Fairfax County, Virginia, Howard County, Maryland, and Prince George's County, Maryland. In contrast, three inner-ring jurisdictions (Washington, D.C., Arlington County, Virginia and Alexandria, Virginia) gained non-Hispanic White residents.
- Nearly all neighboring counties saw increases in their minority populations. Only two counties lost minority residents: Washington, D.C. (-5.0 percent) and Arlington County, Virginia (-0.4 percent).
- Germantown added the most minority residents over the decade (26,839), with Hispanics, Asian and Pacific Islanders and Blacks accounting for roughly even shares of this increase.
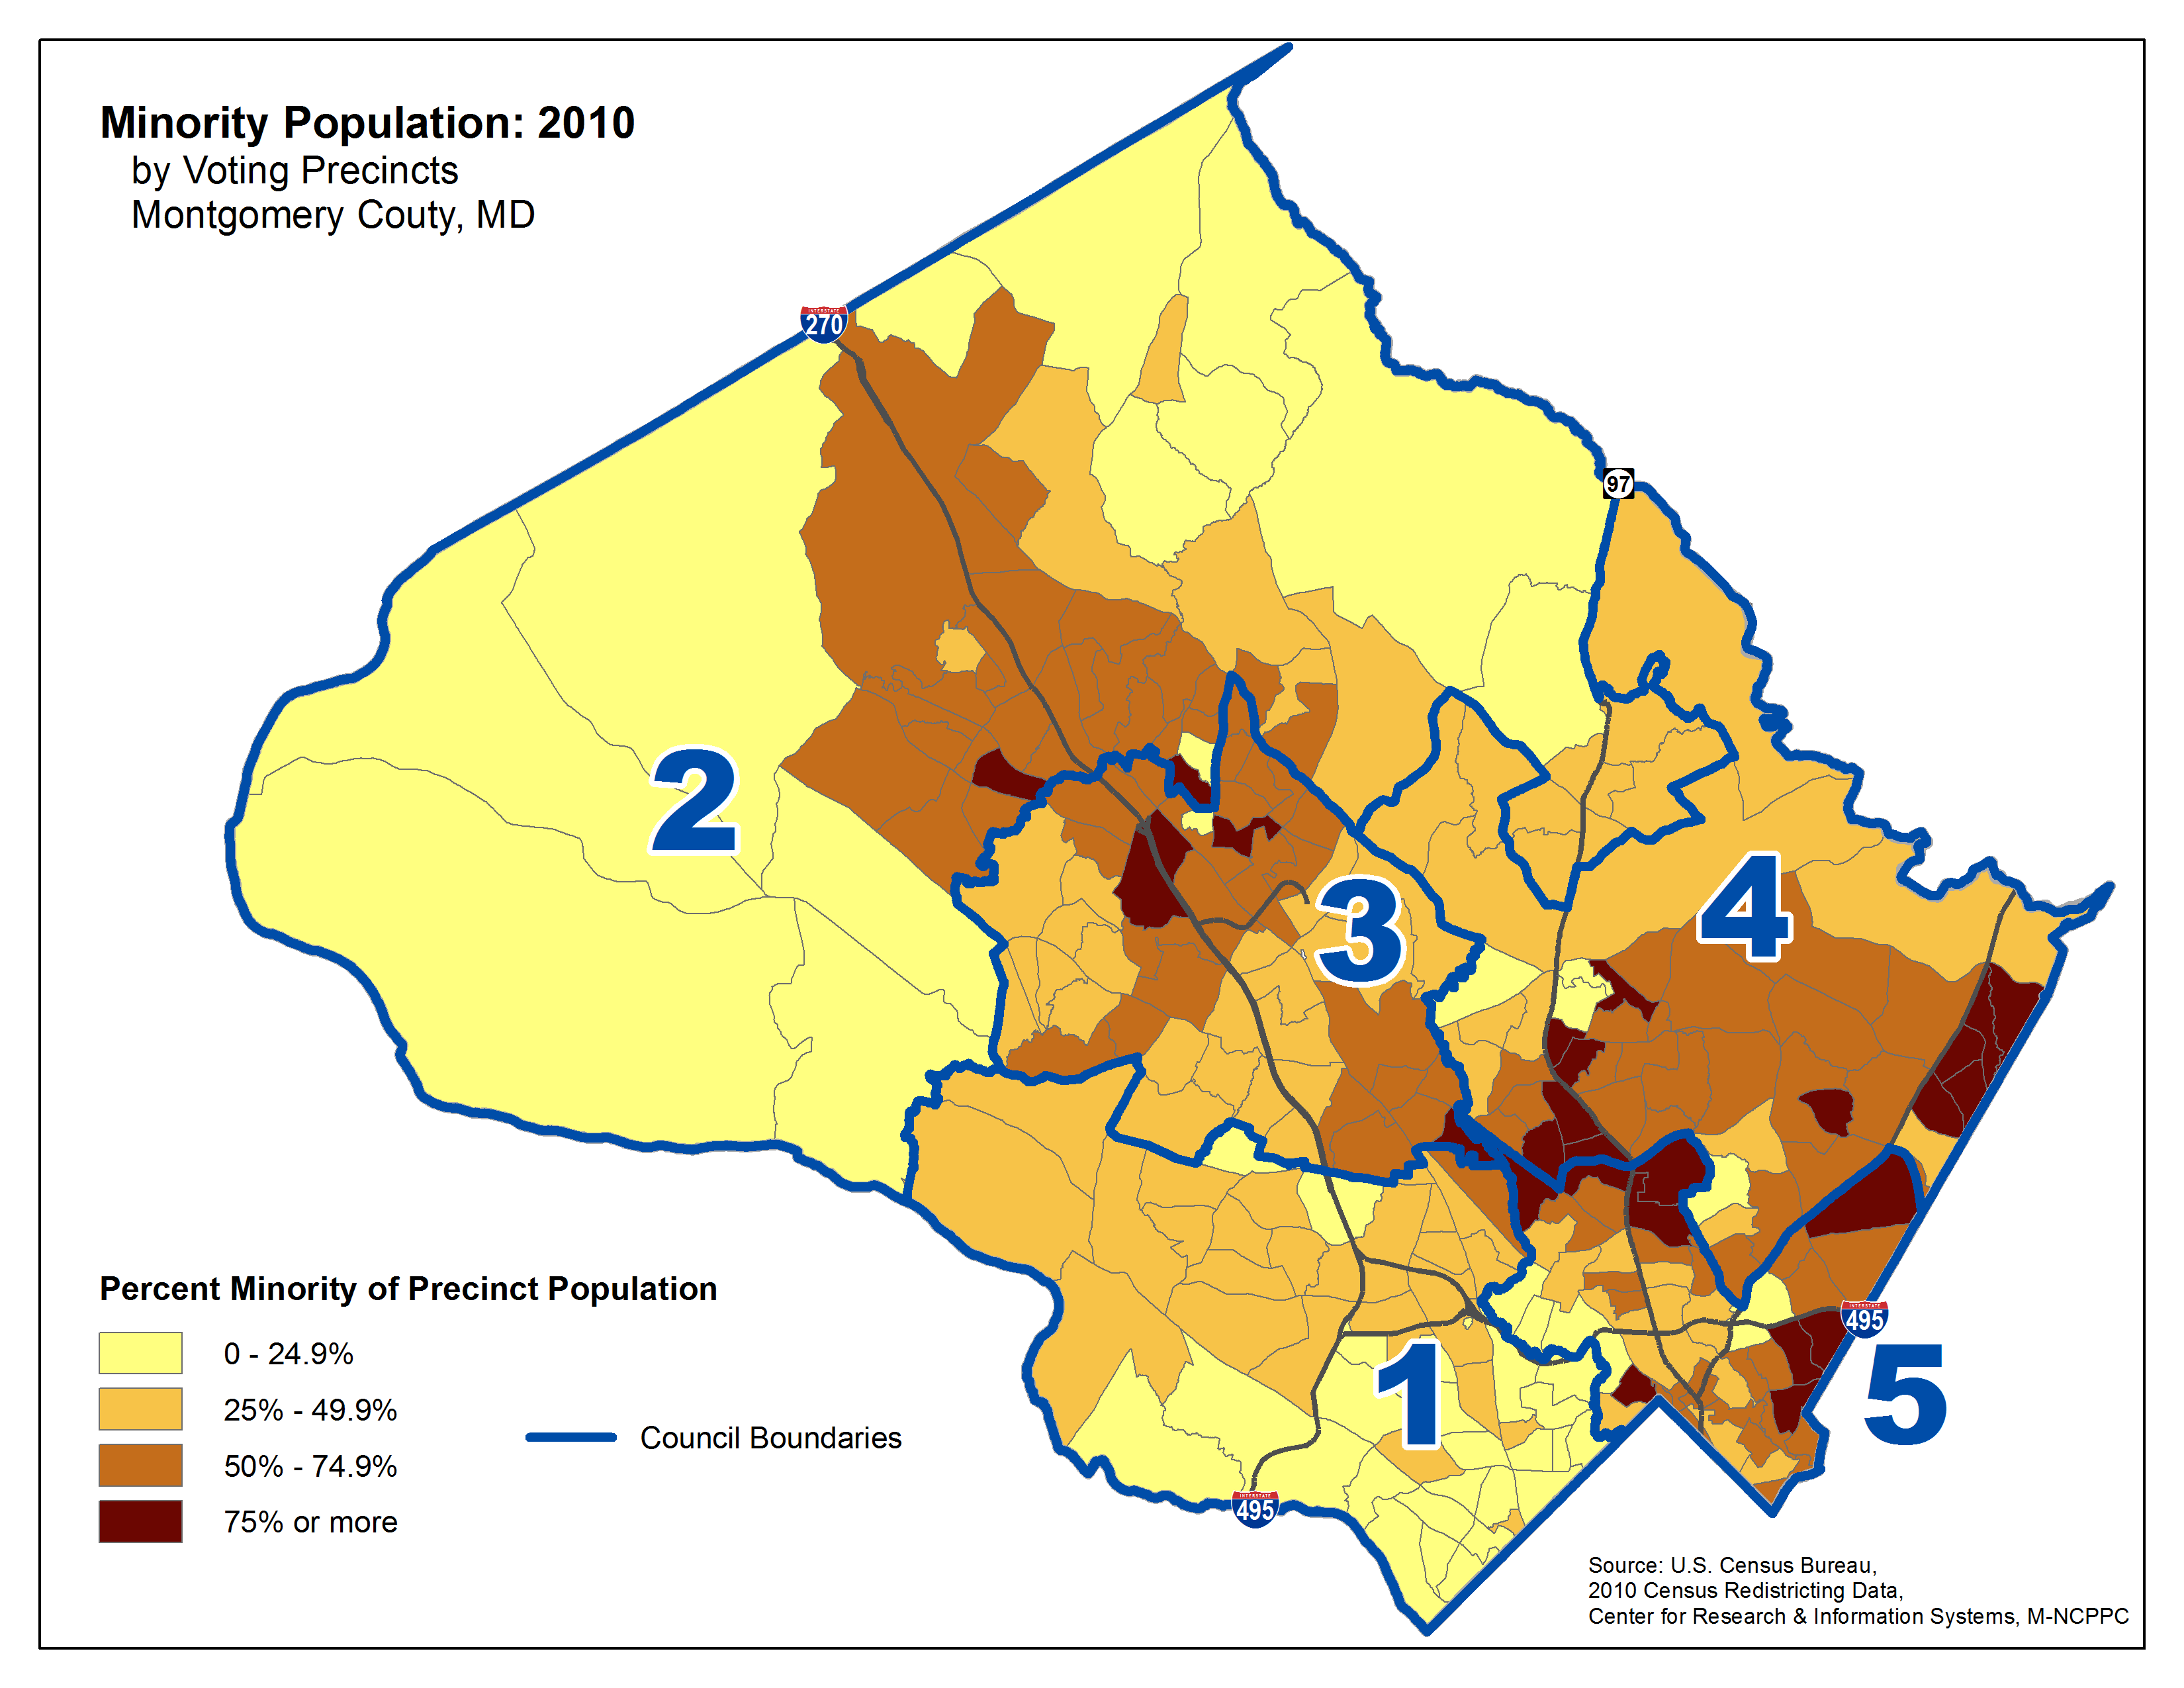
- Minorities now account for more than half of the local population in 2010:
- Montgomery County is now one of 336 "majority-minority" counties in the United States.
- As of 2010, Non-Hispanic Whites make up 49.3 percent of the County's population, down from 59.5 percent in 2000.
- Hispanics are now the County's second largest population group (17.0 percent) followed by Blacks (16.6 percent), Asian and Pacific Islanders (13.9 percent) and Other (3.2 percent).
- All communities within Montgomery County saw an increase in the minority share of their population.
Summary of population change by race and hispanic origin (2000 to 2010)
| Race and Hispanic Origin | 2000 | 2010 | Change, 2000 to 2010 |
|||
|---|---|---|---|---|---|---|
| Number | Population Share | Number | Population Share | Number | Percent | |
| White (non-Hispanic) | 519,318 |
59.5% |
478,765 |
49.3% |
-40,553 |
-7.8% |
| Hispanic or Latino | 100,604 |
11.5% |
165,398 |
17.0% |
64,794 |
64.4% |
| Black | 129,371 |
14.8% |
161,689 |
16.6% |
32,318 |
25.0% |
| Asian and Pacific Islander | 98,632 |
11.3% |
135,104 |
13.9% |
36,472 |
37.0% |
| Other | 25,416 |
2.9% |
30,821 |
3.2% |
5,405 |
21.3% |
| TOTAL POPULATION | 873,341 |
100% |
971,777 |
100% |
98,436 |
11.3% |
| Minority population | 354,023 |
40.5% |
493,012 |
50.7% |
138,989 |
39.3% |
| SOURCE: U.S. Census: 2000 and 2010 Decennial Census, P.L. 94-171 Redistricting Data/Center for Research and Information Systems, Montgomery County Planning Department, M-NCPPC. | ||||||
Data Resources
- Publications: Reports and analyses of Census 2010 data
- Downloadable Census data (advanced users)
- Data Tables by Topic: Summary Demographic Profile | Population | Race and Hispanic Origin | Age | Housing
- Maps: Interactive Map| Census 2010 maps
- Census 2010 Data Release Schedule
- Contact Information
Publications
- Home Ownership Declines in Montgomery County, Per 2010 Census press release (08/16/2011)
- With More Adult Children Living Home and Female-Headed Households, Montgomery County Households Look Very Different press release (05/27/2011)
- Germantown Grows Most — and Most Diverse — in Last Decade press release (02/11/2011)
- As Montgomery County Grows, It Grows More Diverse press release (02/09/2011)
- Montgomery County Population by Council District trendsheet
Downloadable data (advanced users)
- Population by Race
Data tables
tables | maps
Summary demographic profile
- 2010 summary demographic profile of Montgomery County
- 2000 and 2010 demographic profile tables for Montgomery County
- 2010 summary population & housing profile of Montgomery County
- 2010 summary age profile of Montgomery County
- 2010 summary age by race/ethnic group profile of Montgomery County
- 2010 summary detailed race/ethnic group profile of Montgomery County
Total population
Population by race and Hispanic origin
- Population change by selected population group, 1990 to 2010
- Population by race and Hispanic origin, 2010
Population by age group
- Population change by age group and median age, 1990 to 2010
- Population under age 18 and age 18+ combined, 2010
- Population under age 18 (children), 2010
- Population age 18+ (adults), 2010
Housing and households
- Housing units and occupancy
- Households by size, 1990 to 2010
- Households by type, 1990 to 2010
- Households by relationship, 1990 to 2010
- Households by tenure (owner/renter), 1990 to 2010
- Households by tenure and age of householder, 2000 to 2010
- Households by tenure and race of householder, 2000 to 2010
Maps
tables | maps
Population
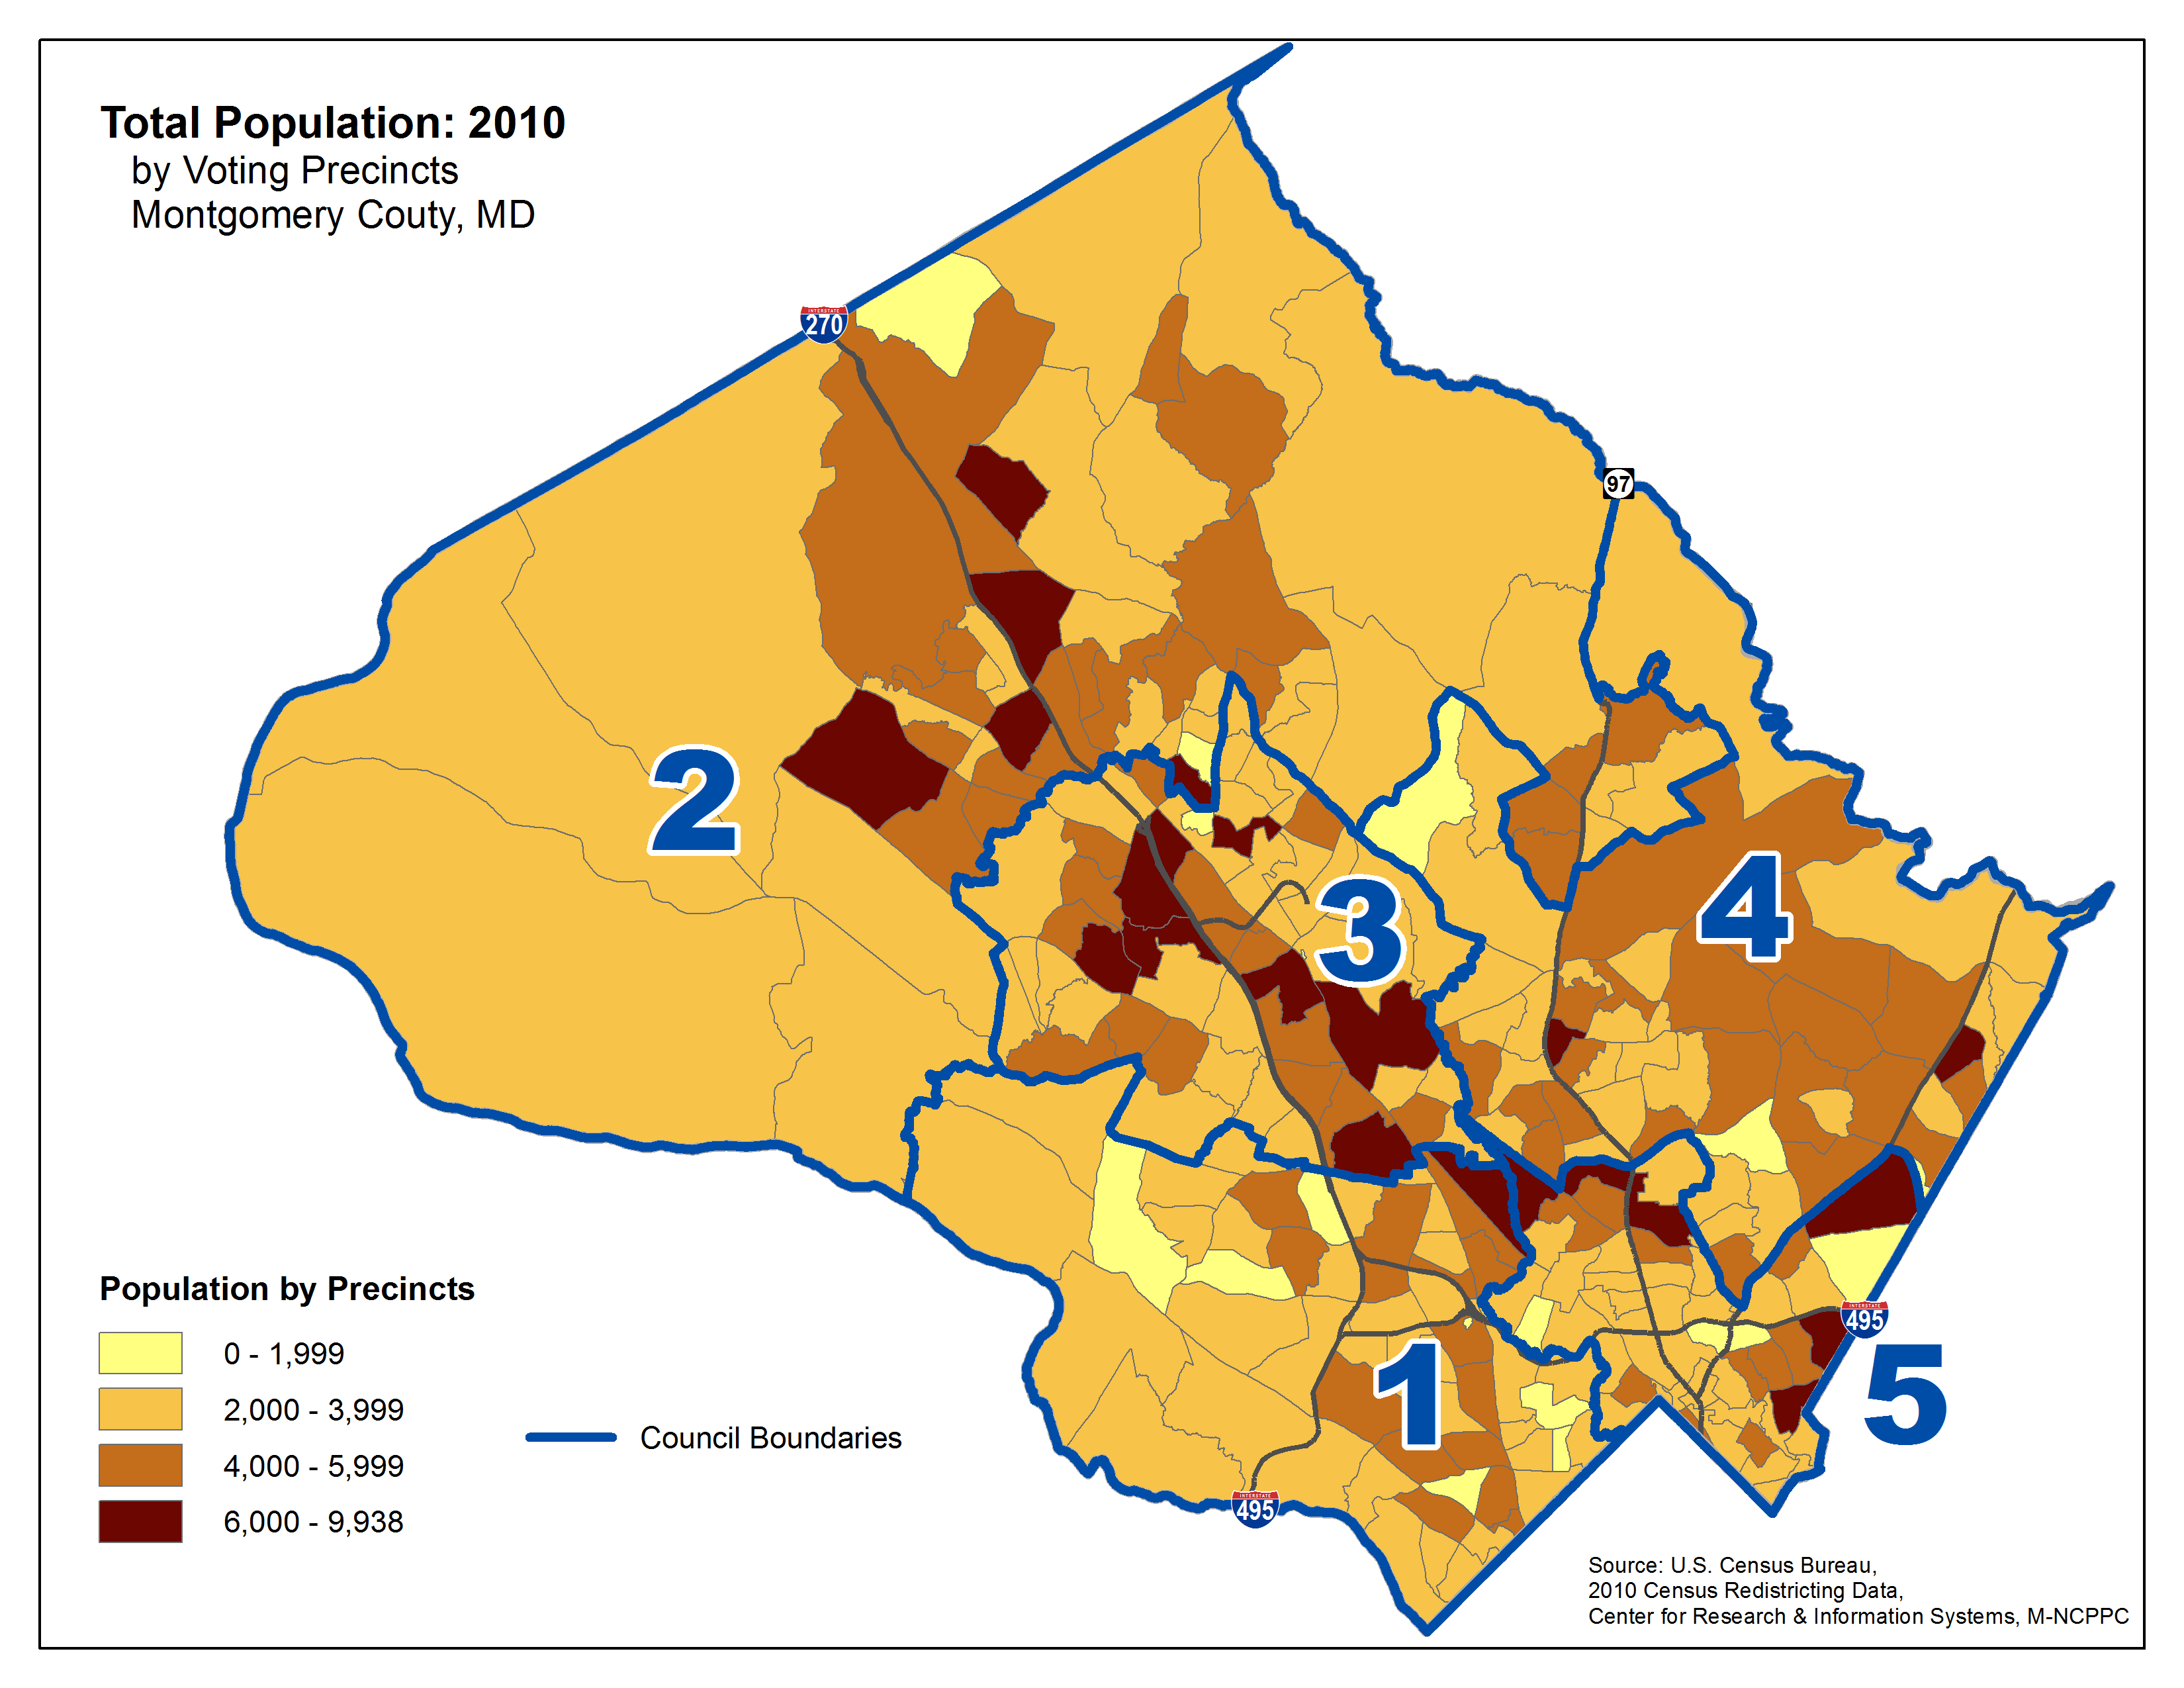
- 2010 Population
- Total population by Precinct
- Minority population by Precinct
- White non-Hispanic population by Precinct | by Census Tract
- Hispanic population by Precinct | by Census Tract
- Black/African American population by Precinct | by Census Tract
- Asian and Pacific Islander population by Precinct | by Census Tract
M-NCPPC staff contact
Pamela Zorich, Research and Information Systems
301-650-5639
Pamela.Zorich@mncppc-mc.org
Date of last update: August 21, 2011