Life Science Center Monitoring Program
New! View the Biennial Master Plan Monitoring Report [PDF] (July 2015)
The information in this monitoring program was used to form recommendations contained in the July 2013 Biennial Master Plan Monitoring Report (read report) for the ongoing implementation of the GSSC Master Plan. The report also includes recommendations for the implementation of the White Flint and Shady Grove Sector Plans.
The Great Seneca Science Corridor Master Plan creates a vision of growth for the county's largest concentration of technology companies. The plan describes a live-work community that fosters bioscience innovations within an attractive, sustainable mixed-use neighborhood.
To achieve the plan's vision, development must be centered around the Corridor Cities Transitway (CCT), a public transit line running from the Shady Grove Metro Station to Clarksburg. The plan's staging requirements are intended to ensure that development of the Life Sciences Center is coordinated with the building of the necessary infrastructure and an adequate transportation system. Learn more in the Great Seneca Science Corridor Implementation Guidelines(500 kb).
The staging plan coordinates development approvals with the timing of infrastructure. Certain staging triggers must be satisfied for Stages 1-4 to be opened for new development approvals, as follows:
Stage 1 - Met
All Stage 1 requirements have been met. All available commercial capacity available in Stage 1 has been allocated; therefore Stage 1 is currently closed for new commercial development applications. Stage 1 remains open to residential development applications.
Commercial development applications will still be accepted for developments with previously approved density (i.e. “pipeline” capacity).
- Approve and adopt a Sectional Map Amendment that sets new zoning in place
- Fund, begin operation of Greater Shady Grove Transportation Management District
- Designate LSC Central, West, Belward and North districts as Road Coad Urban Area
- Include the Rickman Property in the R&D Policy Area
- Develop Monitoring Program
- Establish an Implementation Advisory Committee
- Attempt to secure outside funding for a Health Impact Assessment
- Determine a baseline figure for Non-Auto Driver Mode Share (NADMS)
Stage 2 - Current
- Fund CCT construction from Shady Grove Metro to Metropolitan Grove
- Fund relocation of the Public Safety Training Academy
- Fund LSC Loop Trail
- Attain an 18 percent NADMS
Stage 3 - Future/Pending
- CCT under construction from Shady Grove Metro to Metropolitan Grove; 50% of funds spent
- Fund in the CIP any transportation improvements identified in the biennial monitoring review
- Construct and open at least one public street across LSC West and Belward
- Attain a 23 percent NADMS
Stage 4 - Future/Pending
- CCT is operating between Shady Grove Metro Station and Clarksburg
- Fund in the CIP any transportation improvements identified in the biennial monitoring review
- Attain a 28 percent NADMS
To ensure that staging is properly timed and adequate infrastructure is being provided, the GSSC Plan requires the creation of a biennial monitoring program to track development and staging triggers at each stage of the plan. An Implementation Advisory Committee comprising property owners, residents, and other stakeholders will monitor development plans, staging, and the County Capital Improvements Program, and will report to the Planning Board and County Council.
The Life Science Monitoring System assesses the pace and quality of plan implementation. This program includes periodic assessment of the following:
- Development Approvals
- Commercial to Residential Conversions
- Traffic Performance
- Non-Auto Driver Mode Share (NADMS)
- Capital Improvement Project
- Public Facilities and Amenities
- Subdivision Staging Policy
1. Development Approvals
The plan's staging requirements allow an additional 400,000 square feet of commercial development and 2,500 new dwelling units in Stage 1. Health Care services are not applied to the capacity of Stage 1.
Stage 2 allows for an additional 2.3 million square feet of commercial development and 2,000 new dwelling units. Health Care services are applied to the capacity of Stage 2.
Stage 3 allows for an additional 2.3 million square feet of commercial development and 1,200 new dwelling units.
Stage 4 allows for an additional 1.8 million square feet of commercial development and no new dwelling units.
Commercial development
Available capacity for Stage One: ClosedSquare feet
11.1 million
Residential development
Available capacity for Stage One: 2,500Units
5,800
Pipeline
Applications
| Plan No. | Plan Name | Existing SF | Approved/Unbuilt | Current Approval | Additional SF Requested | Total SF |
|---|---|---|---|---|---|---|
| Plan No. | Plan Name | Existing SF | Approved/Unbuilt | New SF Approved* | Total SF |
|---|---|---|---|---|---|
| 120110080 | 9800 Medical Center Drive | 281,379 | 32,271 | 230,929 | 544,579 |
| 11986115C | Johns Hopkins University Montgomery Co. Medical Center | 742,936 | 151,700 | 169,071 | 1,063,707 |
| 11996110A | Johns Hopkins University Belward Campus | 390,000 | 1,410,000 | 0 | 1,800,000 |
| 12011034A | Travilah Square | 41,802 | 14,490 | 0 | 56,292 |
| 120110160 | Shady Grove Adventist Hospital | 574,980 | 51,930 | 506,946** | 1,133,856 |
* Counts against Commercial staging cap ** Exempt from the requirements of Stage 1 |
|||||
| Plan No. | Plan Name | Existing Units | Approved/Unbuilt | Units Converted from Commercial | Additional Units Requested* | Total Units |
|---|---|---|---|---|---|---|
| * Counts against staging | ||||||
| Plan No. | Plan Name | Existing Units | Approved/Unbuilt | Units Converted from Commercial | New Units Approved* | Total Units |
|---|---|---|---|---|---|---|
| 11986186A | Hanover Shady Grove | 0 | 0 | 366 | 0 | 366 |
| 120120180 | Mallory Square | 0 | 0 | 371 | 311 | 682 |
| 11996112A | Camden Shady Grove (DANAC) | 0 | 0 | 475 | 0 | 475 |
| 120120290 | Travilah Grove (Rickman) | 0 | 300 | 0 | 0 | 300 |
| * Counts against staging | ||||||
2. Commercial to Residential Conversion
The owner of a property approved for commercial development may re-subdivide and convert to residential development. This conversion will be exempt from staging, as long as the change does not increase vehicle trips.
| Plan No. | Plan Name | Commercial Square Feet to be Converted | Residential Units |
|---|---|---|---|
| Plan No. | Plan Name | Commercial Square Feet to be Converted | Residential Units |
|---|---|---|---|
| 11986186A | Hanover Shady Grove | 120,063 | 366 |
| 120120180 | Mallory Square | 112,358 | 371 |
| 11996112A | Camden Shady Grove | 155,330 | 475 |
3. Transportation monitoring
Planners apply two tests to assess transportation adequacy in the Life Sciences Center. Transportation tests balance the number of trips against the transportation infrastructure – transit, roads and pedestrian/cycling routes. Read about transportation tests in the Research and Development Village Policy Area in an excerpt (685 KB) from the 2012 Transportation Policy Area Review Final Report.
Transportation Policy Area Review
Transportation Policy Area Review (TPAR) analyzes roadway and transit adequacy in each of the county’s 30 policy areas. TPAR establishes standards for roadway and transit adequacy and determines which policy areas meet those standards.
TPAR was first approved by the County Council as part of the 2012 Subdivision Staging Policy.
Research and Development Village roadway adequacy
 Click for larger view
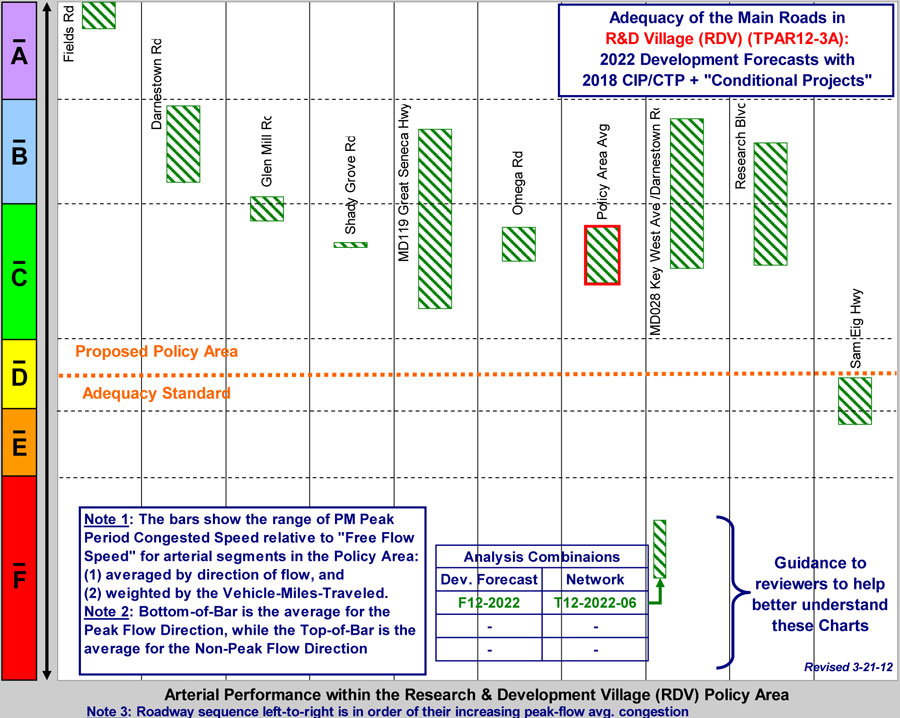
TPAR roadway analysis uses a regional travel demand model to assess the adequacy of main roads in the peak direction during the afternoon rush hour. Results are expressed for each of the major roadways as a Level of Service (LOS) from A to F, with LOS A representing free-flowing traffic, and LOS F representing gridlock.
Transportation planners and engineers consider traffic operating in LOS D conditions during PM peak optimal for an efficient road network and good use of resources in a suburban area.
TPAR is intended to assess overall level of service conditions for all main roads in a policy area, not to achieve adequacy for each individual road. However, this tool can be used to identify adequacy deficiencies along individual roadways and help prioritize where selected improvements may be considered.
The TPAR assessment for the Research and Development Village Policy Area for the year 2022 projects adequate overall roadway adequacy. Assessment of each of the individual major roadways analyzed, however, shows the Sam Eig Highway is projected to exceed the acceptable LOS at times during the PM peak hour. Inadequate level of service traffic conditions also are projected for Sam Eig Highway for shorter term (year 2018) and longer term (year 2040) planning horizons if no improvements are made beyond the current Capital Program.
Research and Development Village transit adequacy
 Click for larger view
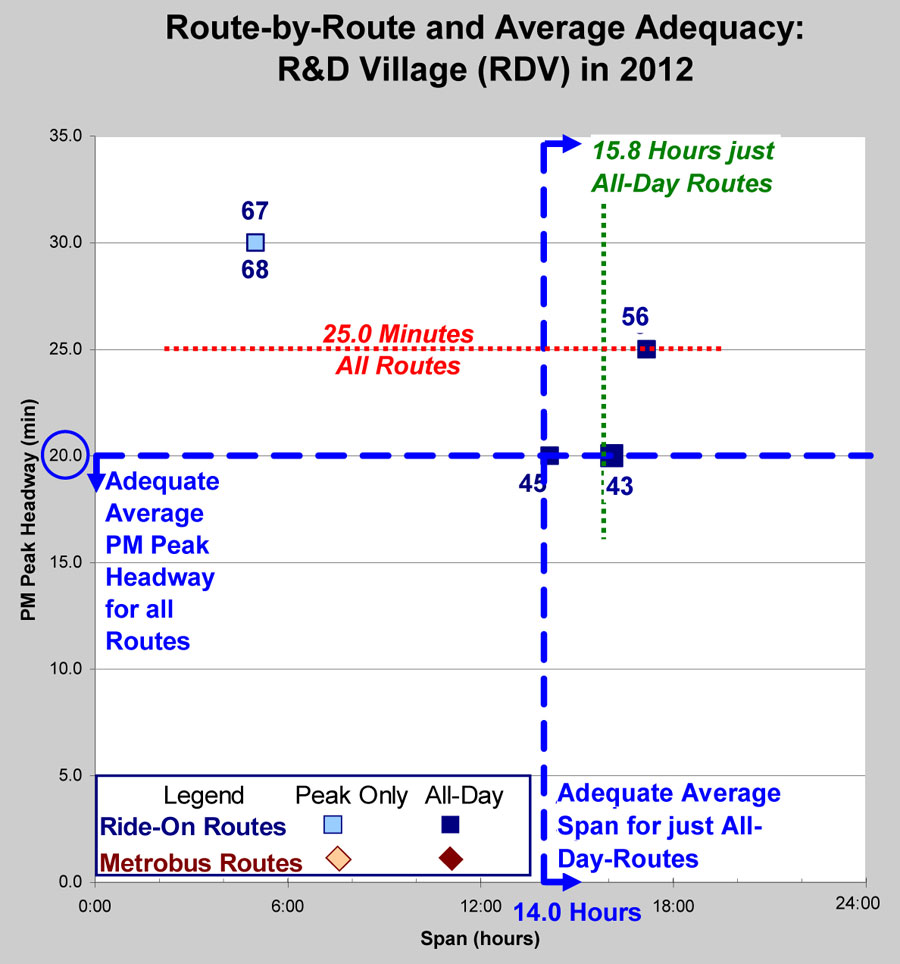
TPAR transit adequacy considers three facets of existing local bus transit service:
- Service Coverage
- Peak Headways
- Span of Service
All three metrics must meet the established standards for a policy area to be considered adequate for transit.
Service Coverage measures the percentage of the policy area that lies within one-third of a mile of transit services such as bus routes. Seventy-five percent of the Research and Development Village Policy Area is within one-third of a mile of existing bus routes. The standard for suburban policy areas is 30 percent; therefore coverage is considered adequate in the Research and Development Village Policy Area.
Analysis of Peak Headways measures the average time between arrival of transit vehicles at a stop during PM peak hours. The Peak Headway standard for the Research and Development Village Policy Area is 20 minutes or less. Current TPAR tests show the headway for the policy area to be 25.8 minutes during PM peak hours; therefore peak headways are considered not adequate. A proposal for a countywide initiative to add more buses to selected routes could bring peak headways up to acceptable levels in the policy area within the next 10 years.
Because the peak headways for transit are not adequate for the Research and Development Village Policy Area, new developments are required to mitigate traffic associated with their construction by paying 25 percent of the development’s total impact fees.
Span of Service looks at the transit system’s hours of operation. The standard for a suburban area is 14 hours of operation. The Span of Service for transit in the Research and Development Village policy area is 15.8 hours; therefore the Span of Service is adequate.
Local Area Transportation Review (LATR)
Local Area Transportation Review (LATR) determines traffic levels at intersections within the Life Science Center. Intersection congestion is measured using Critical Lane Volume (CLV), which measures the number of vehicles that can move through an intersection’s conflicting lanes in an hour.
LATR requires new developments and redevelopments that generate more than 30 new peak hour trips to analyze the adequacy of significant intersections in the vicinity of the development. Intersection performance is measured by assessing the existing and projected CLV against a standard of 1,450. Development that projects a CLV above 1,450 at intersections located within the Research and Development Village policy area will be required to reduce trips or implement intersection improvements. Learn more about LATR and TPAR.
4. Non-Auto Driver Mode Share
Non-Auto Driver Mode Share is the percent of work trips via transit (bus or rail), walking, biking, or carpooling during the peak travel periods of a typical weekday. As of Spring 2015, the current mode share was determined to be 16.1%.
- Before Stage 2 begins, the area must attain 18% mode share
- Before Stage 3 begins, the area must attain 23% mode share
- Before Stage 4 begins, the area must attain 28% mode share
5. Capital Improvement Program
The Capital Improvement Program is the tool through which locally funded public facilities, such as sewers, local roads, schools, libraries, and parks can be scheduled and built, in coordination with and guided by, the Annual Growth Policy and Great Seneca Science Corridor.
| Tied to staging? Y/N | Project Name | Location/Limits | Coordinating agency | Project status | |
|---|---|---|---|---|---|
| N | Travilah Fire Station 32 | 450504 | NW Corner of Darnestown Rd and Shady Grove Rd | DGS | Complete |
| N | North Potomac Community | 13860 Travilah Road | DGS | Under construction | |
| Y | PSTA Relocation | 471102 | LSC West: Key West Ave, Grest Seneca Hgwy | DGS | Under construction |
| Y | CCT Funded | Shady Grove Metro- Metropolitan Grove | MSHA/MTA | Not Funded | |
| Y | CCT Under Construction | Shady Grove Metro- Metropolitan Grove | MSHA/MTA | Not Funded | |
| Y | CCT Operating | Full length | MSHA/MTA | Not Funded | |
| N | Muddy Branch Trail Connector | M-NCPPC/ Private | Not Funded | ||
| Y | LSC Recreation Loop | Throughout LSC | M-NCPPC | Under Study | |
| N | Civic Green | LSC WEST/PSTA | Not Funded | ||
| N | Elementary School | LSC WEST/PSTA | Not Funded | ||
| N | Park (with school) | LSC WEST/PSTA | Not Funded | ||
| N | Traville Local Park | LSC South | M-NCPPC | Not Funded | |
| N | Local Park | Quince Orchard | M-NCPPC | Not Funded | |
| Y | Medical Center Drive Extended | Great Seneca HWY to Key West Avenue | DOT/SHA | Not Funded | |
| N | Decoverly Drive Extended | Johns Hopkins Drive to Muddy Branch Road | DOT/SHA | Not Funded | |
| N | Key West Avenue Widening | Darnestown Road to Shady Grove Road | DOT/SHA | Not Funded | |
| N | Sam Eig Highway/Great Seneca Highway | intersection interchange | DOT/SHA | Not Funded | |
| N | Shady Grove Road/Key West Avenue | intersection interchange | DOT/SHA | Not Funded | |
| N | Great Seneca Highway/Muddy Branch Road | intersection interchange | DOT/SHA | Not Funded |
6. Public Facilities and Amenities
The monitoring program will track attributes of development projects that provide an appropriate environment or to satisfy public needs. Facilities and amenities may include, but are not limited to:
- green area or open space which exceeds the minimum required, with appropriate landscaping and pedestrian circulation;
- streetscaping that includes elements such as plantings, special pavers, bus shelters, benches, and decorative lighting;
- public space designed for performances, events, vending, or recreation;
- new or improved pedestrian walkways, tunnels or bridges;
- features that improve pedestrian access to transit stations;
- dedicated spaces open to the public such as museums, art galleries, cultural arts , community rooms, recreation areas;
- day care for children or senior adults and persons with disabilities; and
- public art.
| Plan | Public Facility or Amenity | |||||||||
|---|---|---|---|---|---|---|---|---|---|---|
| Plan Name | Plan Number(s) | Green Space | Streetscaping | Public Venue | Pedestrian Improvement |
Ped. Access to Transit Station | Public Facility |
Tree Canopy | Public Art | |
| Hanover Shady Grove | 320120020 11986186A 820120190 | Approved Unbuilt | Approved Unbuilt | Approved Unbuilt | Approved Unbuilt | Bike Share Station | Approved Unbuilt | |||
| Camden Shady Grove | 320120050 1996112A 82000018D | Approved Unbuilt | Approved Unbuilt | Planned after CCT constructed | Approved Unbuilt | Approved Unbuilt | Transit Station Space Dedication | Approved Unbuilt | ||
| Mallory Square | 320120010 820120130 |
Under Construction | Under Construction | Under Construction | Under Construction | Bike Share Station | Under Construction | Payment | ||
7. Subdivision Staging Policy – School Capacity
The Growth Policy matches the timing of development with the availability of public services. It ensures that there is enough transportation and school capacity to accommodate new development. The tracking of transportation capacity is covered in 3.0 Traffic Performance and 4.0 Non-Auto Driver Mode Share.
The annual component of the Subdivision Staging Policy is a review of the school capacity test. It reports the program capacity for school clusters throughout the county. If a cluster exceeds a 105-percent program capacity ceiling, residential subdivision within that cluster would be subject to a school facilities payment or a moratorium.
The Life Science Center contains two school clusters: Gaithersburg Cluster and Thomas S. Wootton Cluster.
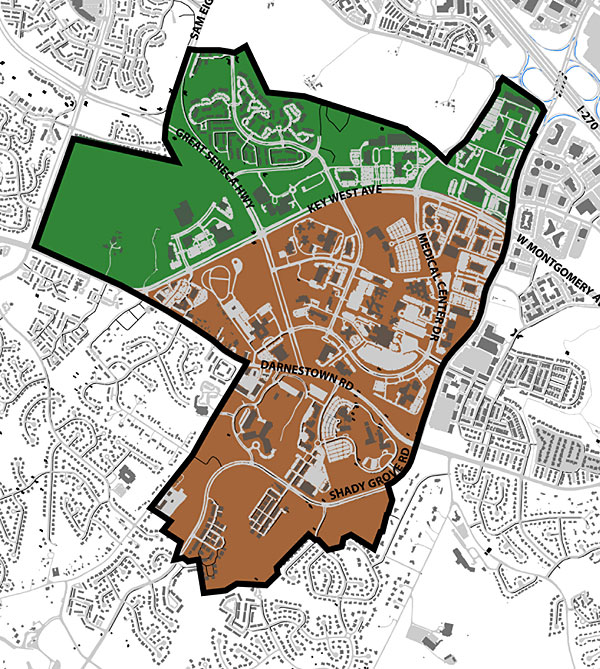 School clusters - click for a larger view
*Green areas are the Gaithersburg Cluster
*Brown areas are the Wootton Cluster
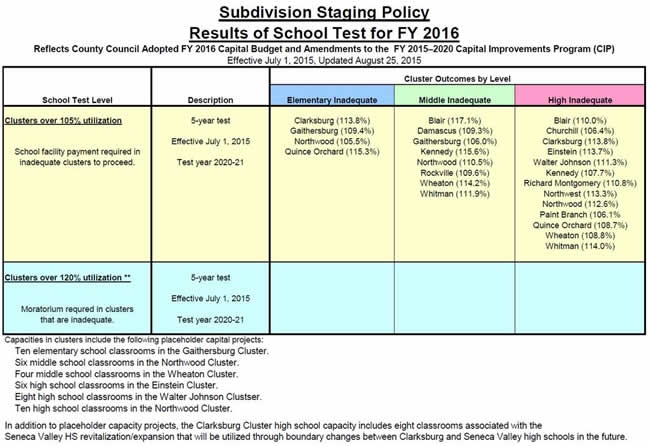 School Test for FY 2016 -click for larger view
Last updated: March 22, 2016