Bicycle Demand Map
 As the number of people using bicycles for travel in the Washington, D.C. region continues to rise, Montgomery County planners have created a map that depicts demand for bicycle transportation.
In July 2011, transportation planners drafted the map to help the Planning Board and other policy-makers prioritize where to invest in bicycle routes and support facilities. Called a bicycle heat map, the tool predicts where demand for bike commuting, errands, or other non-recreation trips is greatest. Greater clusters of homes and jobs, proximity to transit, schools, and other community facilities, and connections between activity centers, all lead to greater bicycling demand.
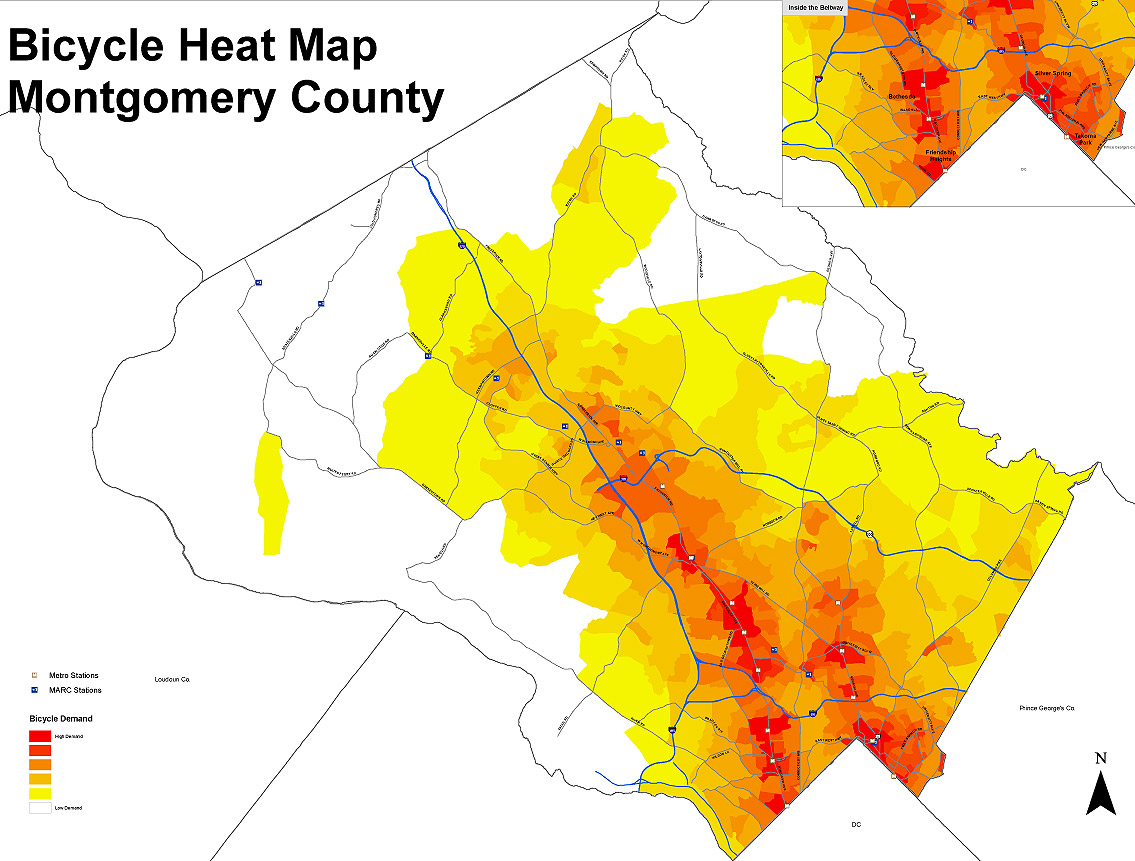 Click for larger view, or click here to download the full PDF map (2.6MB)
The map shows areas of greatest demand in bright red, with tones stepping down to yellow, then white as demand decreases. The map also shows the location of all Metro stops and MARC stations. Based on the methodology used to create the map, the areas with the greatest transportation demand for bicycling include Bethesda/Friendship Heights and Silver Spring. A second tier of high demand areas includes Rockville, White Flint (Rockville Pike corridor) and Wheaton. While implementing the Master Plan of Bikeways in these areas tends to be costly, these routes also attract the most cyclists.
View the heat map with existing bikeways and other infrastructure.
The County has plans to build a network of bikeways, including nearly 400 miles of shared use paths and over 150 miles of bike lanes. Currently, the County has built around one-third of the shared use paths and one-fifth of the bike lanes.
Comments
Please help us improve the draft bicycle heat map.
blog comments powered by DisqusMethodology
The heat map uses 11 factors to estimate demand for bicycle transportation at the census block group level.
| FACTOR | RATIONALE | WEIGHT (points)* |
DATA SOURCE |
|---|---|---|---|
| Residential Density | Most trips start or end at a home or job making residential and employment clusters the major indications of the demand for bike travel. | 0 to 30 points | Planning Dept Parcel File |
| Employment Density | 0 to 30 points | MWCOG trip table | |
| Through Trip Demand | While other factors capture the demand for bicycle facilities in major activity centers (such as Bethesda and Silver Spring), this factor captures the desire to travel between activity centers (such as along the Capital Crescent Trail or East-West Highway). Learn more** about this analysis. | 0 to 15 points | Planning Dept GIS |
| Proximity to Metrorail Station | Cycling is a solution to the "last mile" problem, the distance between one's home or work and a mass transit stop. | 0 to 30 points | Planning Dept GIS |
| Proximity to MARC Station | 0 to 3 points | Planning Dept GIS | |
| Proximity to Recreation Centers | Those major destinations generate demand for people to cycle. | 0 to 1 point | Planning Dept GIS |
| Proximity to Libraries | 0 to 1 point | Planning Dept GIS | |
| Proximity to Elementary Schools | Students that live close to a public school are more likely to bicycle, because school bus service is typically only provided to high school students living more than two miles from school, middle school students living more than 1.5 miles from school, and elementary school students living more than one mile from school. | 0 to 3 points | Planning Dept GIS |
| Proximity to Middle Schools | 0 to 3 points | Planning Dept GIS | |
| Proximity to High Schools | 0 to 3 points | Planning Dept GIS | |
| Proximity to Universities | College students tend to bicycle more than any other group. Many students lack cars; others do not wish to pay for limited parking. | 0 to 3 points | Planning Dept GIS |
* The points for each block group were added to produce a composite score. Point values for the block groups ranged from 0 in the Agricultural Reserve to nearly 100 in Silver Spring and Friendship Heights. Of the 552 block groups in Montgomery County, only 24 received more than 50 points. Therefore, block groups with more than 50 points received the highest category of demand shown as red.
** The Through Trip analysis captures bicycle demand between trip generators by:
NOTE: It is important to note that the number of bicycle trips is based on the distance the cyclists travel for existing bicyclists, not the distance the potential cyclists will travel. For that reason, the bicycle trip totals are likely inflated. However, the impact on the relative demand for travel between each TAZ should be limited.
- Creating a Trip Table: Trip tables indicate the number of trips by all transportation modes between each TAZ in the region in a matrix format. In this model we created a synthetic trip table by summing the productions and attractions for each TAZ and then distributing them based on column and row totals.
- Developing a Bicycle Decay Function: The bicycle decay function indicates the potential for a trip to be made by bicycle and is based on the trip distance. It was developed from MWCOG travel surveys and represents the distance that cyclists travel for existing bike trips.
- Creating a Bicycle Decay Table: This table indicates the potential for trips between each TAZ to be made by bicycle. It was created by applying the distance between each TAZ to the bicycle decay function.
- Creating a Bicycle Trip Table: This table indicates the number of cyclists that will travel between each TAZ. It was created by multiplying the number of trips in the Trip Table by the potential for bicycling in the Bicycle Decay Table.
- Calculating the Bicycle Trips per TAZ: Using GIS, lines were created connecting each TAZ. The bicycle trips in the Bicycle Trip Table were then assigned to those lines. The number of bicycle trips passing through each TAZ were then summed. Results were normalized by dividing the result by the area of the TAZ.
- Scaled each TAZ: The resulting value for each TAZ was then converted to a scale from 0 to 1 by dividing the number of trip passing through the TAZ by the maximum number of bicycle trips traveling through a TAZ. The higher the number, the greater the demand for travel between activity centers.
Map with bikeways
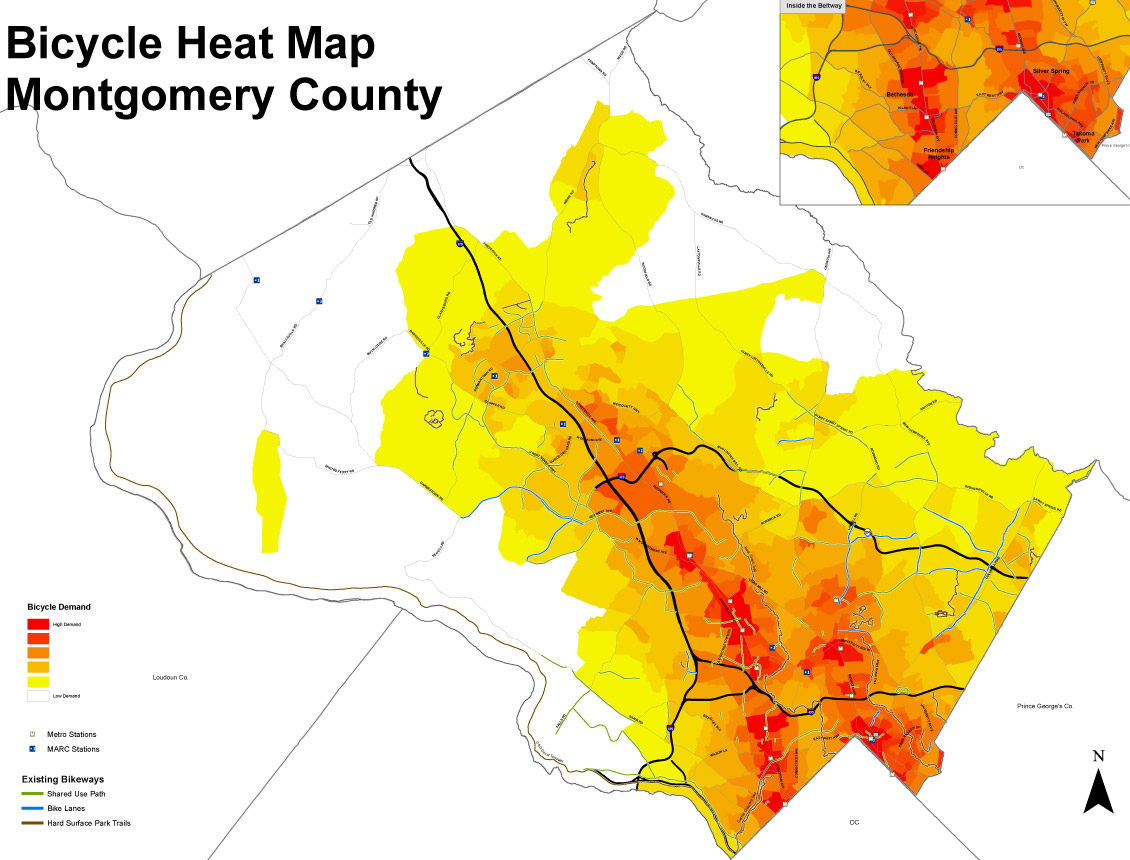 Click for larger view, or click here to download the full PDF map (3.4MB)
 M-NCPPC staff contact
David Anspacher, Transportation Planning
301-495-2191
David.Anspacher@mncppc-mc.org
Date of last update: September 13, 2011