Intersection Analysis Application
About
The Montgomery County Intersection Analysis Application is an interactive, live querying tool dedicated to intersection critical lane volume datasets. The data from this tool are derived from turning movement counts from State Highway Administration, Montgomery County Department of Transportation, Montgomery County "Move/Transportation Planning" Division, and various traffic engineering consulting firms. The information is intended for use by anyone interested in county-wide intersection traffic counts, and critical lane volumes.
Details
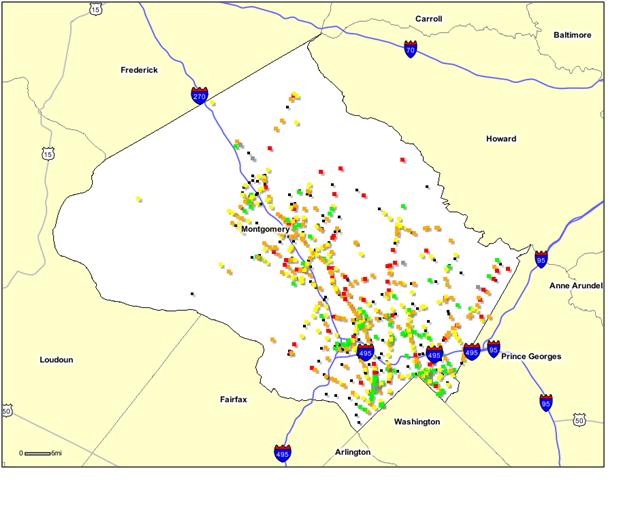
The Department's Intersection Analysis Database contains the essential data needed to calculate and identify levels of congestion at signalized intersections throughout the County. A map of the most recent congestion measurements serves as the background of this online application. The critical lane volume (CLV) measure of congestion that is calculated mathematically using the following variables for a particular intersection: a) throughput and conflicting movement traffic volume data b) geometric configuration information and c) traffic signal phasing specifications. Furthermore, this calculation uses the lane configuration and lane use factors for each of the intersection's approach legs to determine the north/south and east/west peak direction flow of traffic, which are also referred to as the "critical movements". The signal phasing then specifies whether or not the approach traffic on a specific leg of the intersection moves independently from the traffic approaching from the opposite direction, which is also known as the conflicting movement. These conflicting movements are taken into consideration when calculating the CLV of an intersection. LATR standards are taken into consideration based on Growth Policy efforts, which dictate the maximum level of congestion allowed for a policy area.
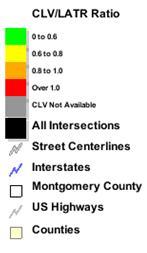
All available intersections shown on the map have a CLV/LATR Ratio value that ranges from 0 to greater than 1. The CLV/LATR Ratio is simply a value that measures the degree to which an intersection meets or exceeds their LATR Standard, according to current Growth Policy. For example, within the application, if an intersection that is queried exceeds their LATR standard, it will appear as a red square on the map, thus representing "Over 1.00". The color scheme for other CLV/LATR Ratio classifications are shown in the sample graphic below.
Tools
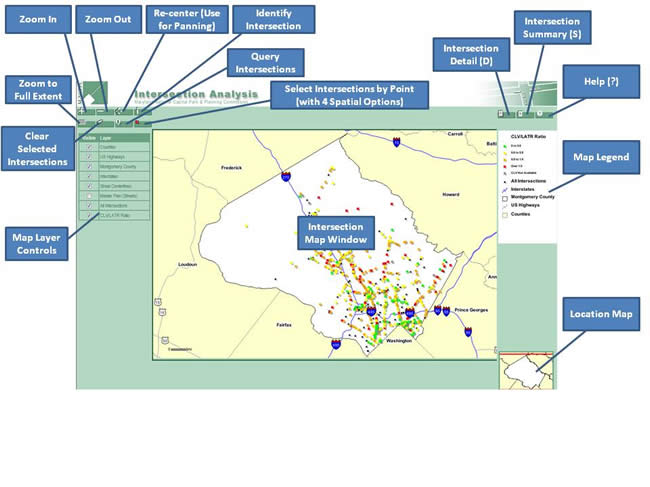
The "Tools" symbols from right to left are as follows: (Top Row) Zoom In, Zoom Out, Recenter, Identify Intersection (Bottom Row) Zoom to Full Extent, Clear Selected Intersections, Query for Intersections, Select Intersections By Point (with 4 spatial selection options). You can also make visible any of the available layers. The tools on the right side of the application are: Intersection Detail (D), Intersection Summary (S), and Help (?). Information gathered by the Intersection Detail, and Summary can be exported as a comma delimited text file for further use.
Intersection Detail
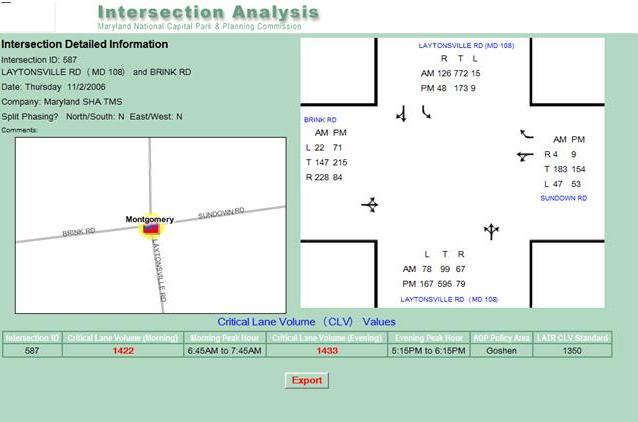
"Intersection Detail" describes critical lane volumes for all left, through, and right movements for each leg of an intersection in a geometric configuration diagram. It also provides the AM/PM Peak Hour, CLV, LATR standard, and the associated policy area.
Intersection Summary
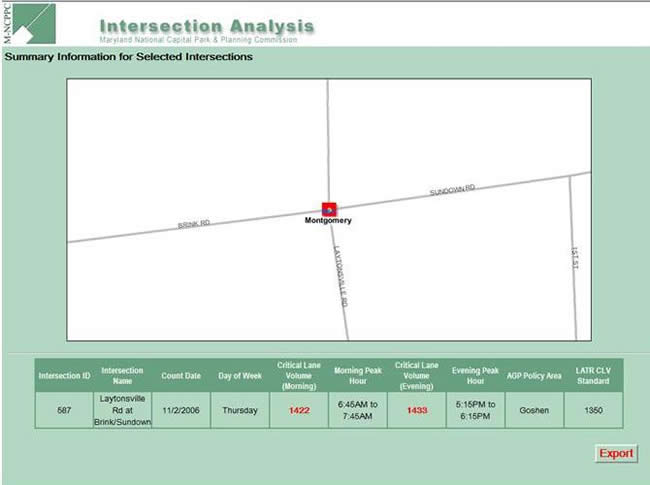
"Intersection Summary" simply breaks down the intersection(s) based on when it was counted, its CLV, its AM/PM Peak Hour, Policy Area and LATR Standard. It doesn't provide a geometric configuration diagram showing the breakdown of critical movements.
M-NCPPC Staff Contact
Jaesup Lee, Functional Planning & Policy Division
301-495-4720
jaesup.lee@montgomeryplanning.org
Date of last update: October 13, 2015