Economic Forces That Shape Montgomery County
Detailed Summary - October 1996
NOTE: Click thumbnails to see larger picture
Job Growth
 Montgomery
County's economy is strong, with job growth slow but
steady. Montgomery County has achieved enviable
economic success and its economy is basically strong.
However, percentage job growth since ther ecession
has been slow compared to the region, state, and nation.
Montgomery
County's economy is strong, with job growth slow but
steady. Montgomery County has achieved enviable
economic success and its economy is basically strong.
However, percentage job growth since ther ecession
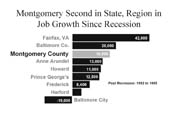
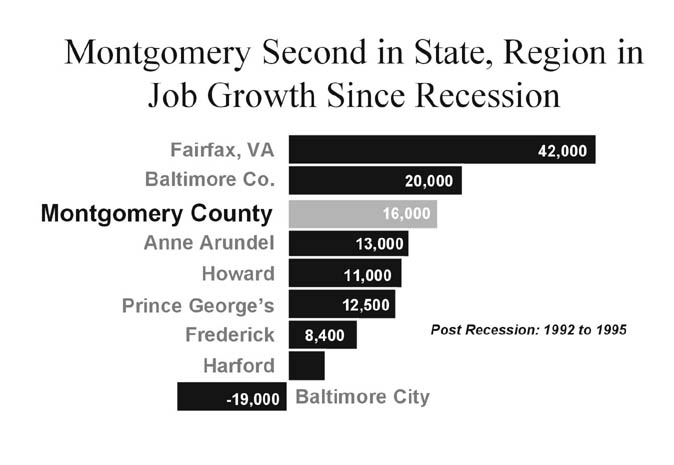
has been slow compared to the region, state, and nation.- In actual numbers, the County is adding more jobs than many other localities. In the metro area, Montogmery is second only to Fairfax County in the number of new jobs since the recession. In the state, Montgomery County is second only to Baltimore County.
 Virtually
all job growth since the recession continues to be
in the private sector. Private sector jobs are
growing at a 2.2 percent annual rate, while the number
of public sector jobs is declining, led by losses
in federal jobs here and around the region.
Virtually
all job growth since the recession continues to be
in the private sector. Private sector jobs are
growing at a 2.2 percent annual rate, while the number
of public sector jobs is declining, led by losses
in federal jobs here and around the region. - New jobs are good ones. High- and medium-wage jobs outperformed low-wage jobs during the recession and after. Income growth has outpaced inflation in the past three years.
- The County's basic sectors held steady during the recession and have gained since. "Basic" sectors are higher wage jobs in industries that bring income into the County from elsewhere and create other jobs.
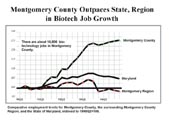
 Biotechnology
continues to be a star performer, but other high-tech
sectors also shine. The County is outpacing the
region and state in biotechnology, electronics and
instruments manufacturing, and telecommunications.
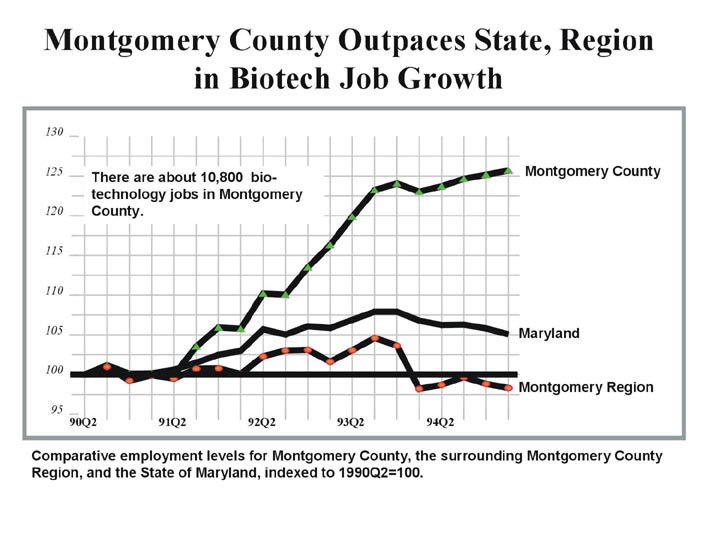
Biotechnology
continues to be a star performer, but other high-tech
sectors also shine. The County is outpacing the
region and state in biotechnology, electronics and
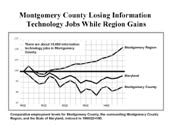
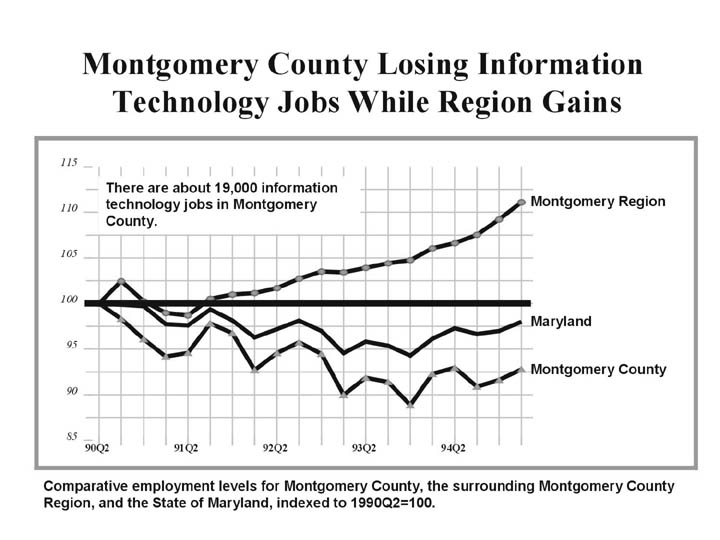
instruments manufacturing, and telecommunications. - The County has lost job in the infromation technology sectors. These sectors are engines of growth for other localities. The County has also lost jobs in the aerospace and the research & testing sectors.
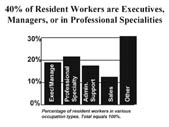
Work Force Characteristics
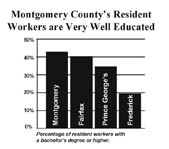 Montgomery
County's labor force is nearly identical to Fairfax
County's. Prince George's and Frederick Counties'
workers are
little less educated, less well-paid, and less likely
to be managers or in professional specialties.
Montgomery
County's labor force is nearly identical to Fairfax
County's. Prince George's and Frederick Counties'
workers are
little less educated, less well-paid, and less likely
to be managers or in professional specialties.- Less than half of Montgomery County's labor force is under 35. Prince George's County has one of the youngest labor forces in the region.
- Two-thirds of the County's jobholders also live here. Almost 390,000 persons were employed in Montgomery County in 1990.
- The number of employed County residents has grown 6 percent since 1990. This includes both those who work in the County and those who commute elsewhere.
- Many Prince George's County residents work in Montgomery County. Of the County's in-commuters, twice as many come from Prince George's as any other jurisdiction.
 The
County's resident labor force is older and more educated
than its in-commuters. Resident workers are also
more likely to be female.
The
County's resident labor force is older and more educated
than its in-commuters. Resident workers are also
more likely to be female. - In-commuters earn more, on average, than the County's resident workers. Higher wages can be an incentive to travel further.


Availability of Sites for Commercial Development
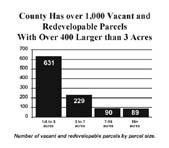 Montgomery
County has a wide range of types and locations of
vacant and redevelopable land to support both short
and long-range business growth. "Redevelopable"
is defined as improved properties where the existing
improvements are worth less than the value of the
land.
Montgomery
County has a wide range of types and locations of
vacant and redevelopable land to support both short
and long-range business growth. "Redevelopable"
is defined as improved properties where the existing
improvements are worth less than the value of the
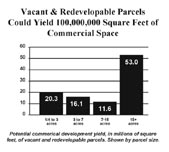
land. - There are 1,038 vacant or redevelopable parcels larger than 1/2 acre in the County. While the majority of the vacant and redevelopable parcels fit into the "redevelopable" category, the vacant parcels can support more development. This list also includes CBD sites larger than 1/4 acre.
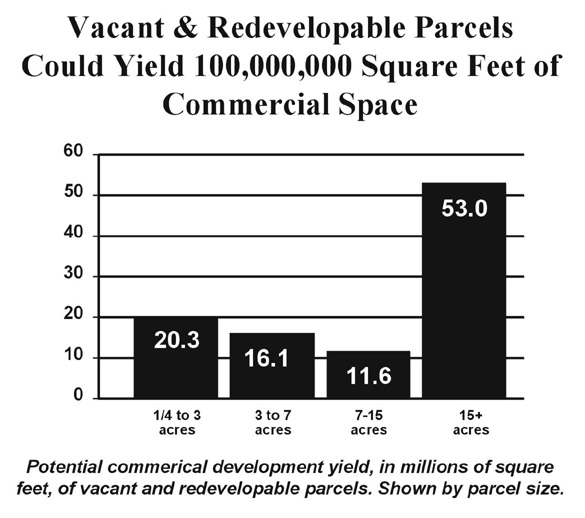
- About 61 million square feet of commercial space could be developed on the vacant parcels alone. This compares to the 152 million square feet of commercial space in the County today.
- Most vacant and redevelopable land is in the I-270 Corridor. The I-270 Corridor accounts for over 50 percent of the total supply of sites.
 The
County has nearly 130 sites that can support large
office buildings. Of these, 66 could support office
parks.
The
County has nearly 130 sites that can support large
office buildings. Of these, 66 could support office
parks. - About 30 million square feet of commercial development has already been approved. Three-quarters of this is in the I-270 Corridor. Nearly 72 percent of approved development Countywide is office space.
- Most of the vacant and redevelopable parcels are zoned to allow office buildings. However, the E1, E2, R&D, and I3 zones account for 1/3 of the County's potential additional commercial square footage.
- The I1 zone is predominate among vacant and redevelopable parcels (195 sites). However, the I3 zone could yield the most commercial square feet (27.5 million square feet).
- The County has about 42 CBD-zoned sites that are vacant or redevelopable. Development of all these parcels at average FARs or master plan caps would yeild about 10 million square feet of office space.

Commercial Space Characteristics
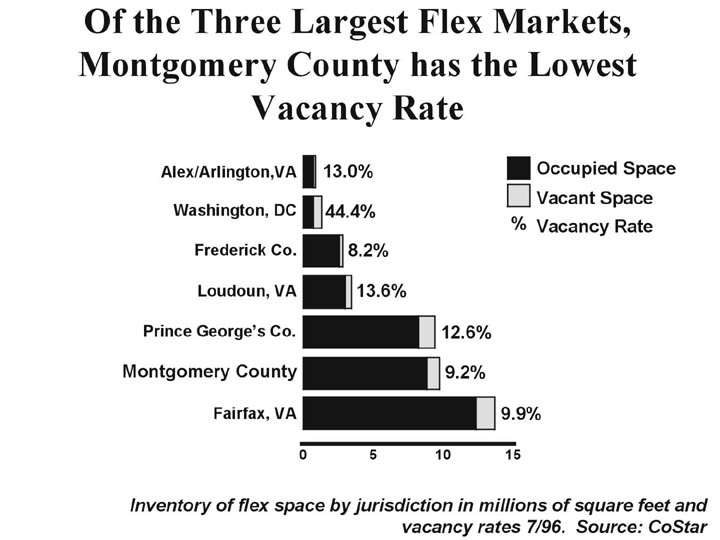
 About
70 percent of the major employment space is office. Industrial space accounts for a bit more than 15 percent;
flex space accounts for a little less than 15 percent.
About
70 percent of the major employment space is office. Industrial space accounts for a bit more than 15 percent;
flex space accounts for a little less than 15 percent.
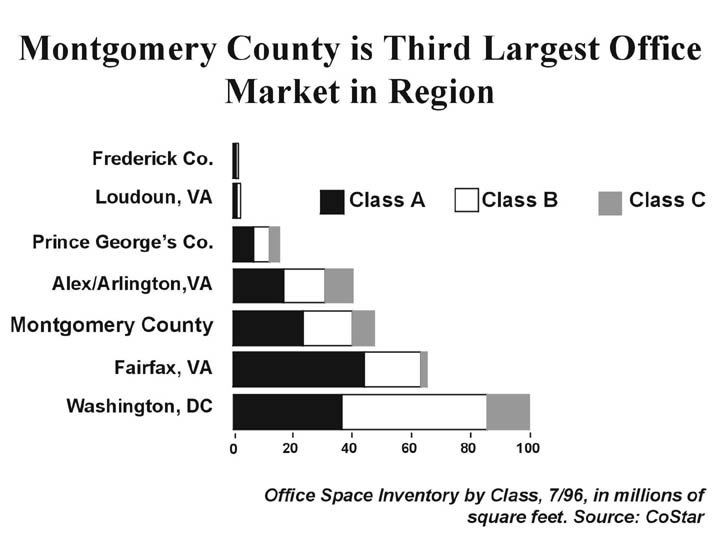
About half of Montgomery County's office space is Class A; the rest is B and C space. Of the suburban jurisdictions, only the Arlington/Alexandria market has more B and C than Montgomery County.
 In
the last seven years, Montgomery County built about
half the amount of office space as Fairfax County. About 13 million square feet of office space was built
in Montgomery County between 1987 and 1995,
compared to 24 million square feet in Fairfax County
and 5.3 million in Prince George's County. Almost
all of this space was built before 1992. Fairfax's
large inventory of vacant space pushed down rents and
attracted tenants from around the region.
In
the last seven years, Montgomery County built about
half the amount of office space as Fairfax County. About 13 million square feet of office space was built
in Montgomery County between 1987 and 1995,
compared to 24 million square feet in Fairfax County
and 5.3 million in Prince George's County. Almost
all of this space was built before 1992. Fairfax's
large inventory of vacant space pushed down rents and
attracted tenants from around the region.
Montgomery County has led Fairfax and Prince George's in office completions since 1992. Montgomery completed 2.7 million square feet during 1993, 1994 and 1995, while Fairfax completed about 600,000 square feet and Prince George's about 900,000 square feet.
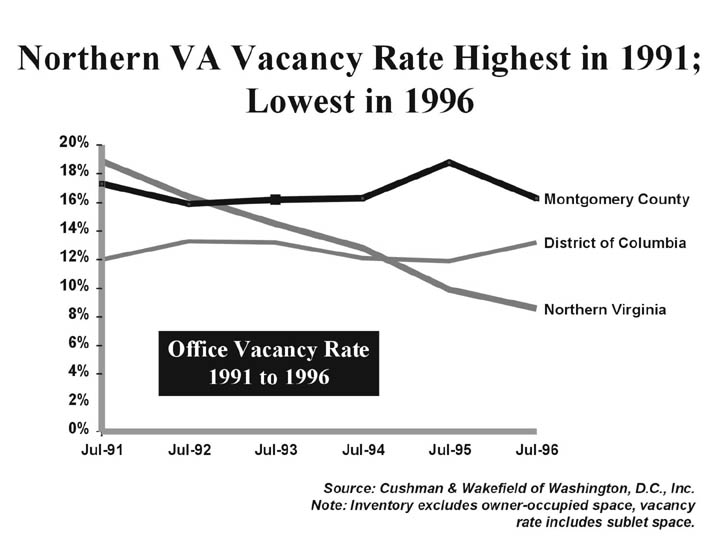
 Montgomery
County's office vacancy rate is now higher, and its
rents now lower, than Fairfax County. However,
most of the County's
Class A office space, its flex space, and its industrial
space have low vacancy rates. Class B/C and other
space space accounts for most of the vacancies.
Montgomery
County's office vacancy rate is now higher, and its
rents now lower, than Fairfax County. However,
most of the County's
Class A office space, its flex space, and its industrial
space have low vacancy rates. Class B/C and other
space space accounts for most of the vacancies.
Business Location and Space Preferences
- Businesses locate within the County to be near specific government agencies. The high proportion of bio-tech firms in the County is a obvious example.
 Once
in the County, businesses do not appear to place a
high priority on further proximity to government agencies. Businesses in industries related to a government agency's
mission tend to locate anywhere within a 20-30 minute
drive from that agency. That's a wide variety of locations,
because many of the County's employment centers are
within 30 minutes of each other.
Once
in the County, businesses do not appear to place a
high priority on further proximity to government agencies. Businesses in industries related to a government agency's
mission tend to locate anywhere within a 20-30 minute
drive from that agency. That's a wide variety of locations,
because many of the County's employment centers are
within 30 minutes of each other. - The type of space occupied by a sector is surprisingly unrelated to industry. The space occupied by businesses in a given sector tends to reflect the size of the company (and perhaps its level of success), rather than the type of business it is in.
- The larger the business, the more likely it is located in Class A office space. This trend holds true for a wide range of industries, even those technical specialties that might be expected to prefer flex space or industrial space.
- Smaller businesses are located in a variety of space types. A significant number of the very small firms (0-4 employees) are located in homes.
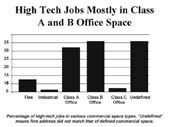
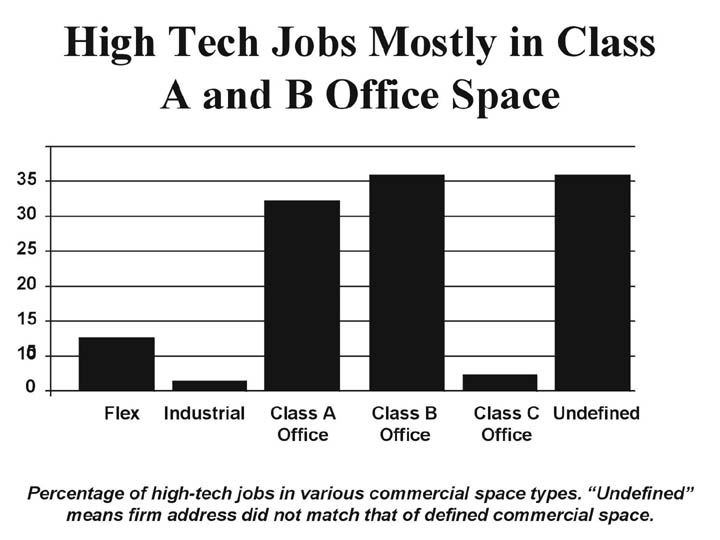
- Among high-tech firms, 91 percent of all jobs are located in Class A and B office space. Just 9 percent are located in flex or industrial space.
Business Environment: Federal Government Impact
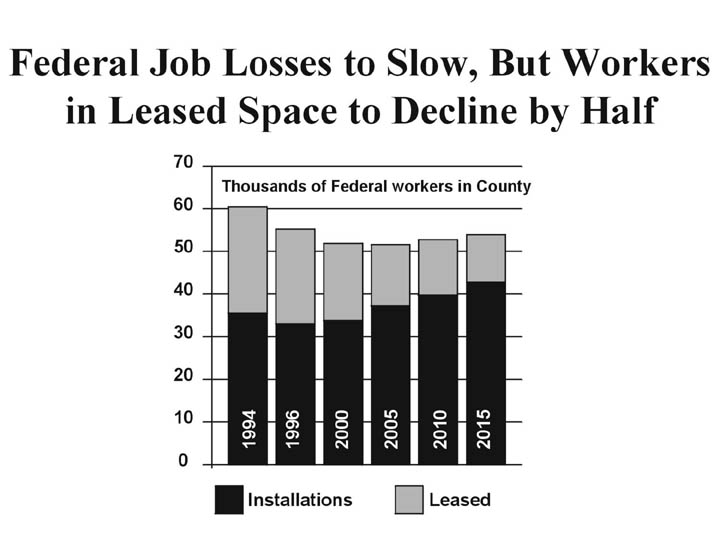
 Montgomery
County federal agencies appear to have relatively
good prospects. There will be continued downsizing,
but federal job loss is expected to be limited to
2 percent through 2015.
Montgomery
County federal agencies appear to have relatively
good prospects. There will be continued downsizing,
but federal job loss is expected to be limited to
2 percent through 2015. - Federally-leased space in the County will continue to declinethrough 2015. Current federal policies prefer owned space to leased space.
- The Food and Drug Administration and the National Institutes of Health will lead trend from leased to owned space. Much of this space is desirable Class A space.
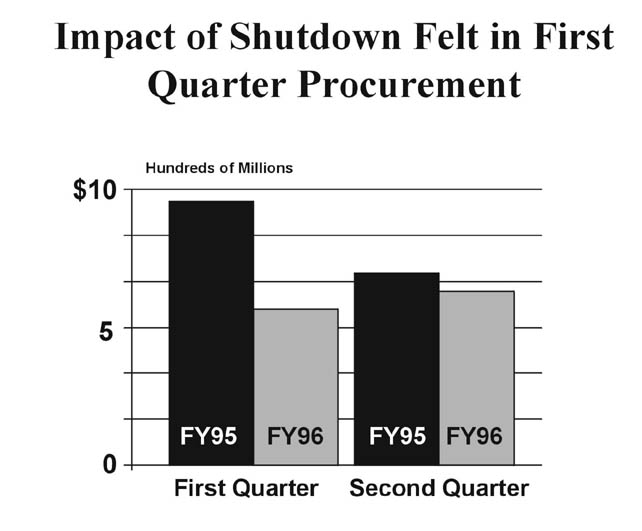
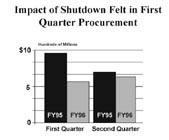 Federal
procurement increased in the County through the 1990s
until the government shutdown. During this period,
procurement was down 47 percent.
Federal
procurement increased in the County through the 1990s
until the government shutdown. During this period,
procurement was down 47 percent.- In the most recent quarter (April, May and June 1996), the County regained about half the procurement lost during the shutdown. Some spending, such as travel, training, and day-to-day supplies, may never be recovered. HHS and the Defense department account for more than half of local procurement spending in FY95.